Shh... Many units sell without being publicly listed.
Discover hidden opportunities at Seward Park (1-2)! Reach out today to learn about select off-market listings.
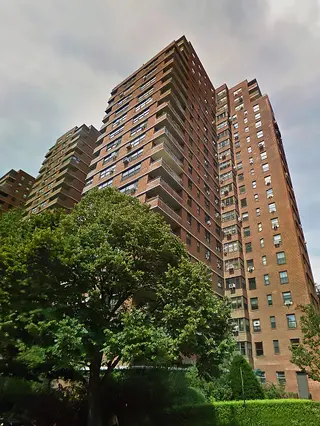
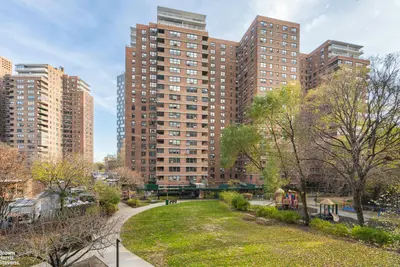
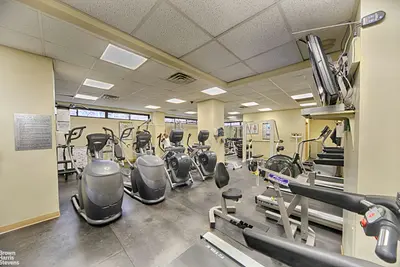
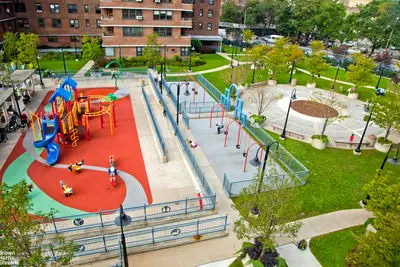
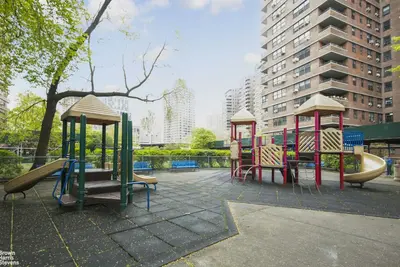
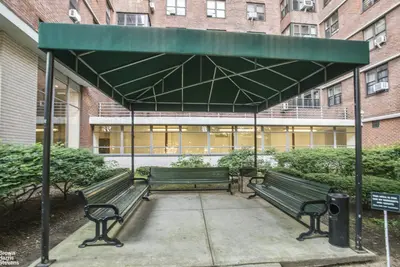
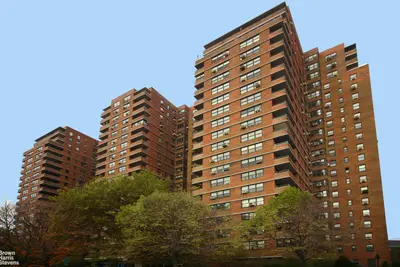
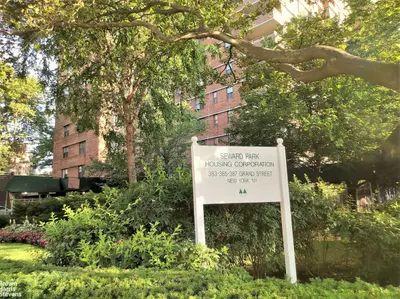

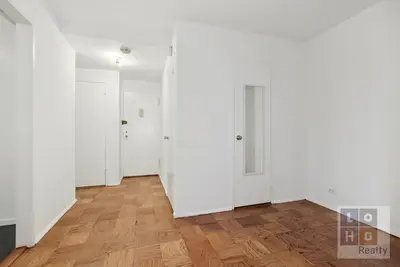
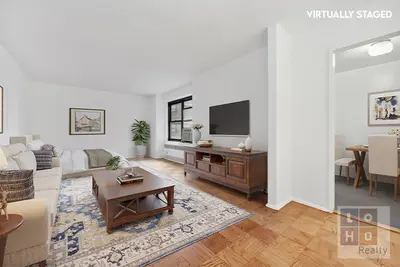
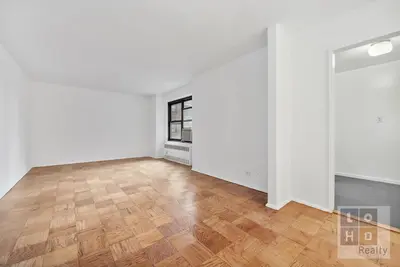
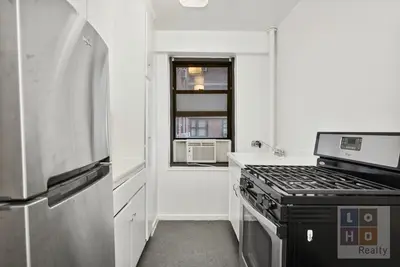
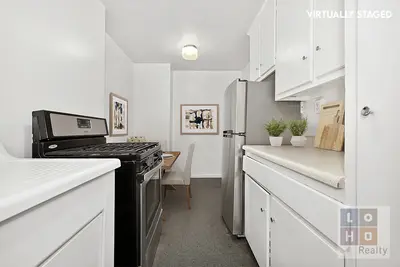
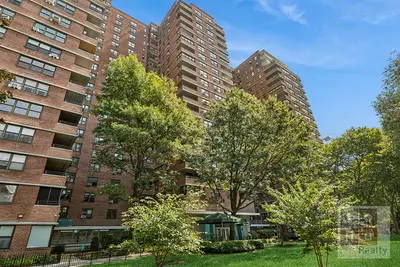


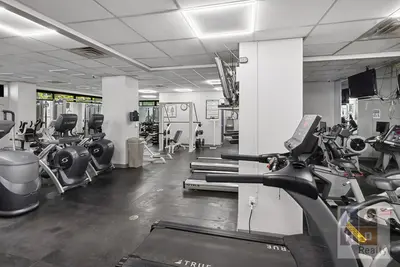

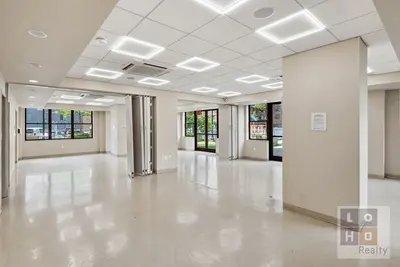

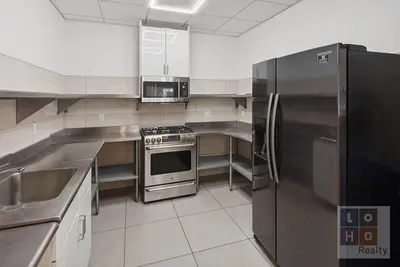

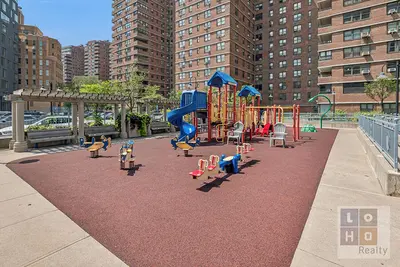
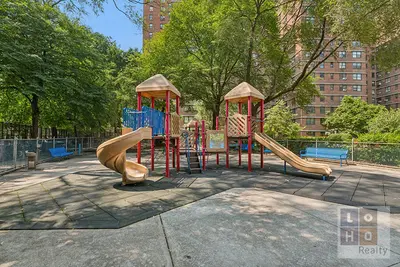

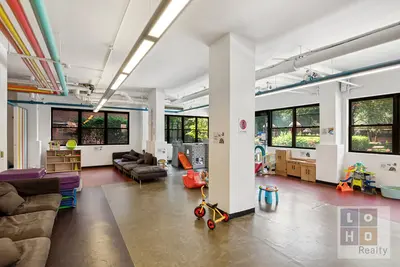
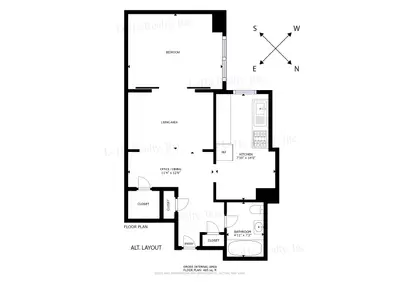
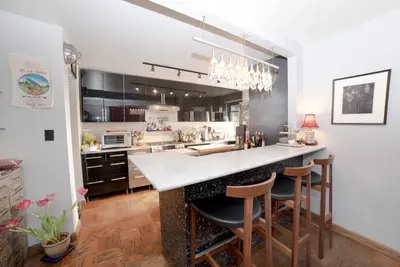
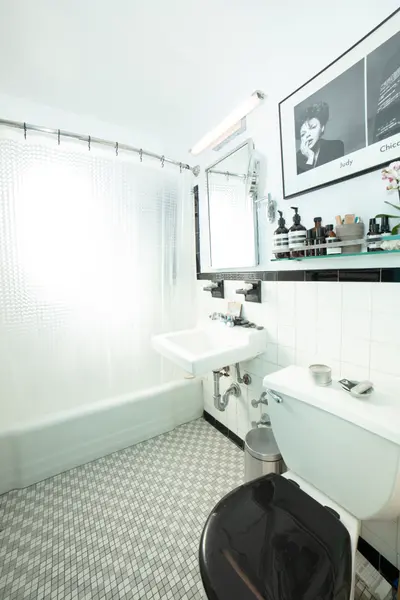

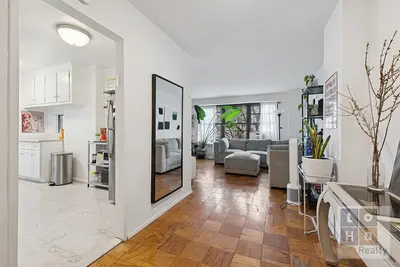


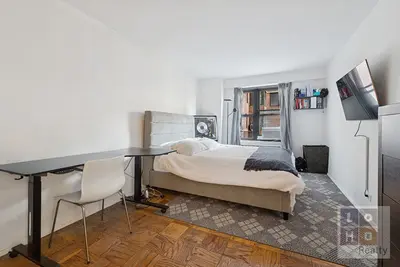


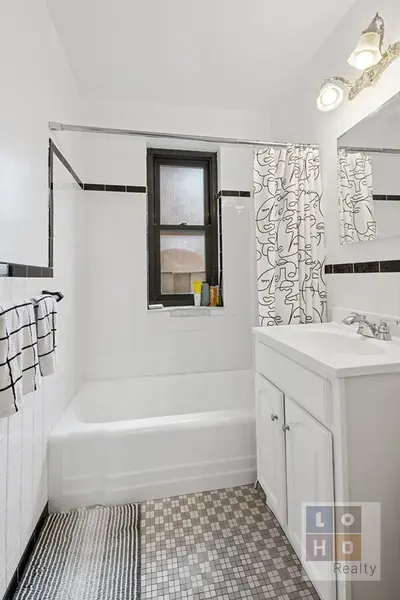

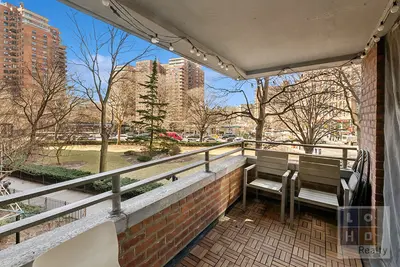


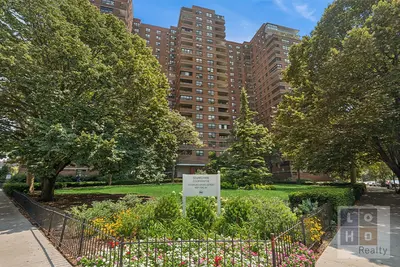

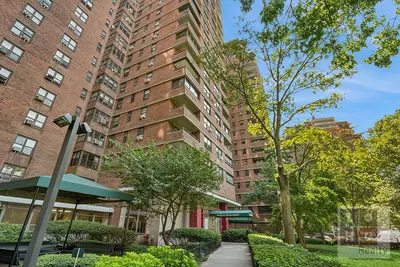
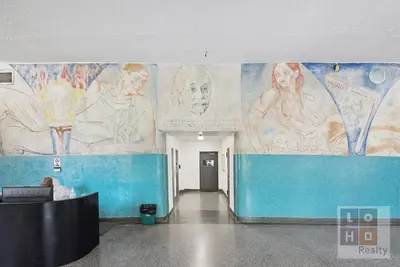

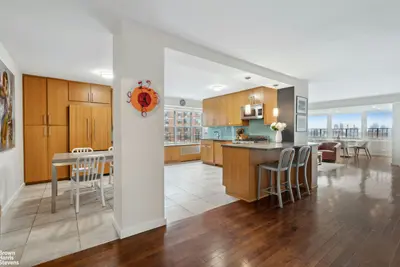
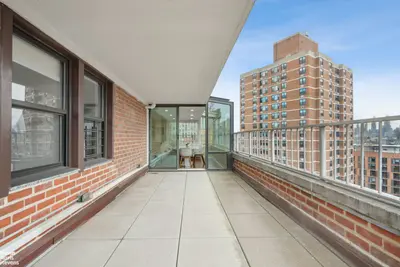
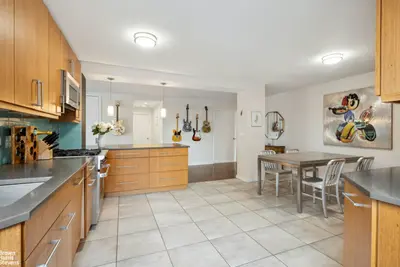
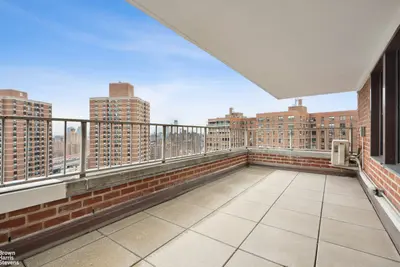
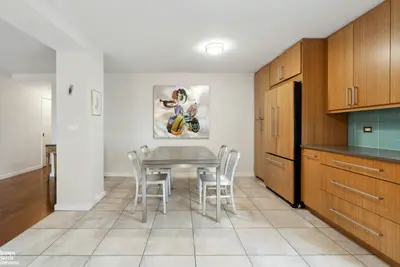
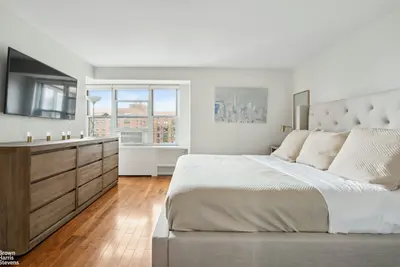
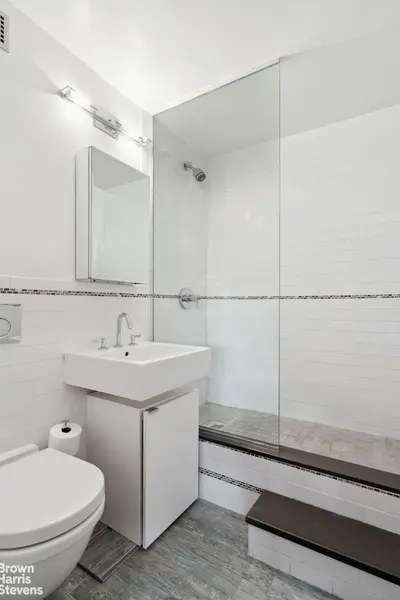
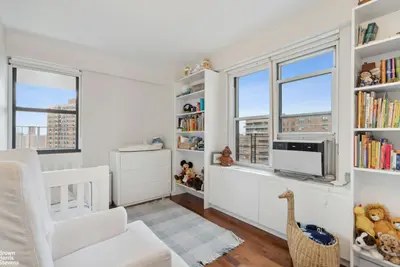
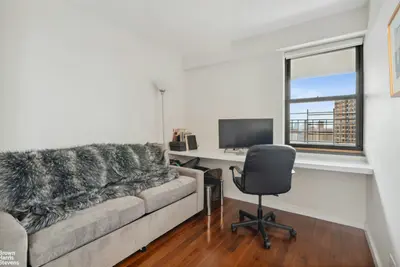
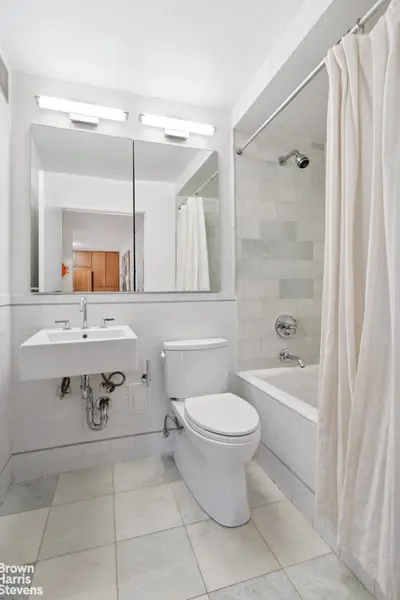
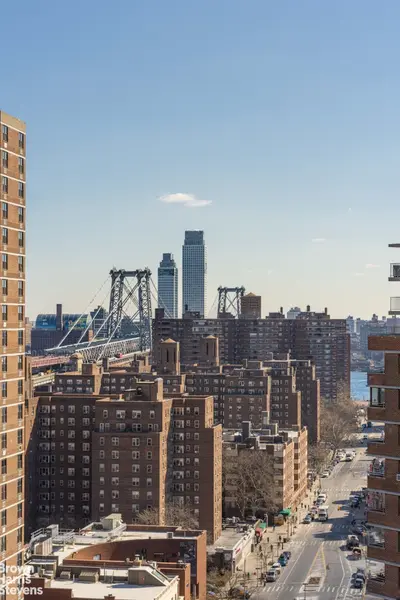
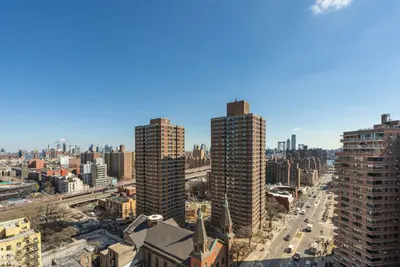
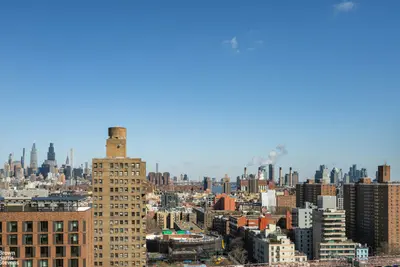
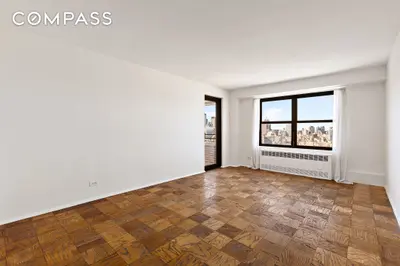
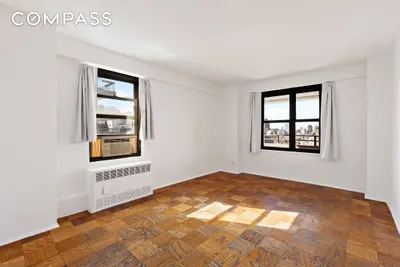
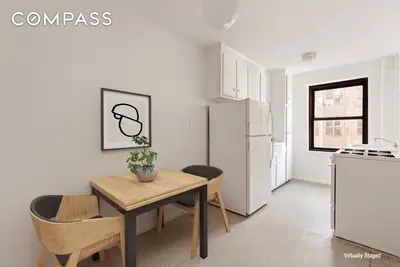
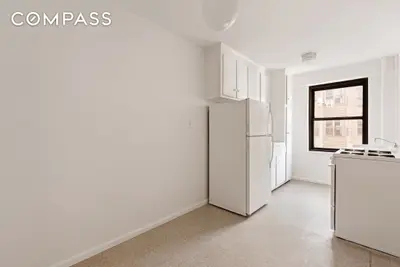
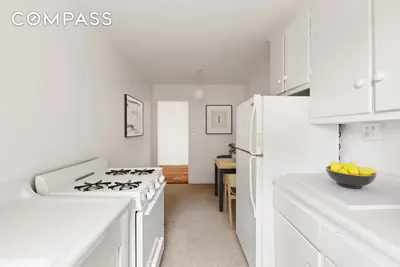
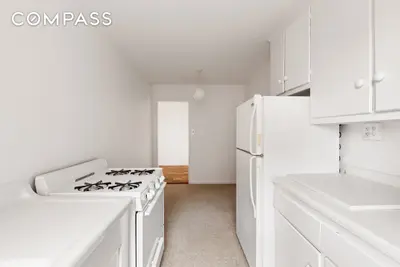
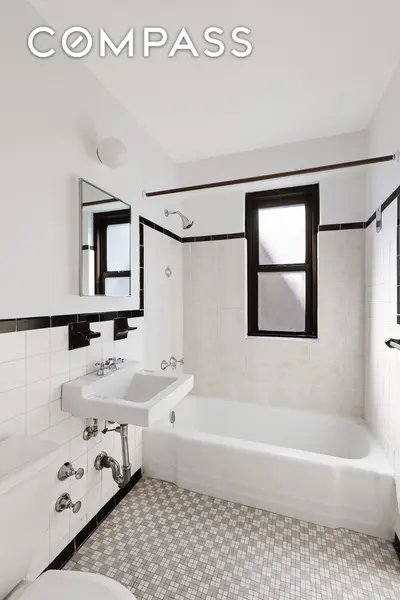
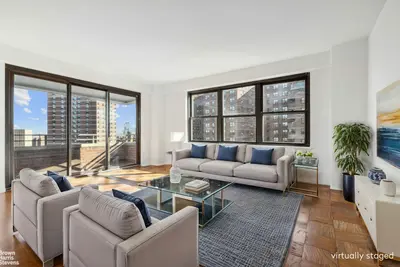
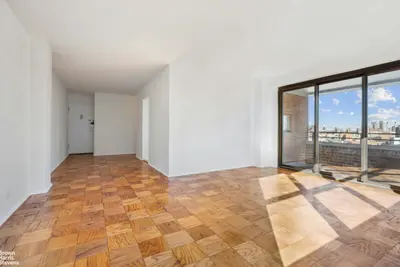
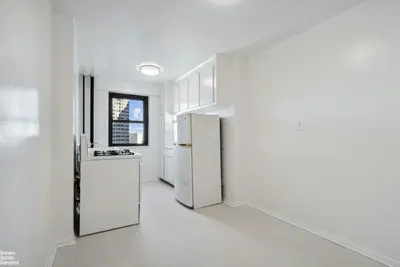
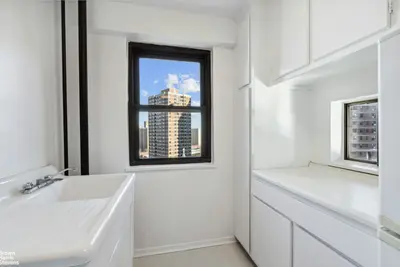
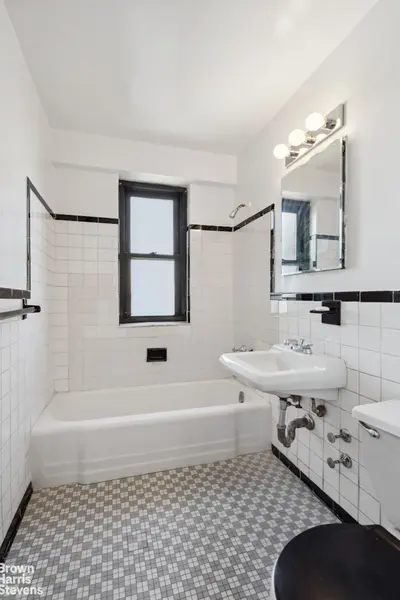
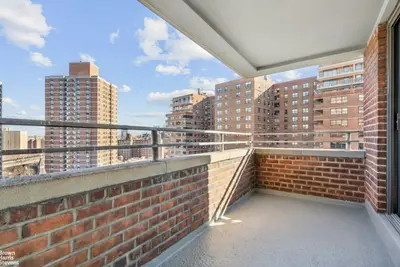
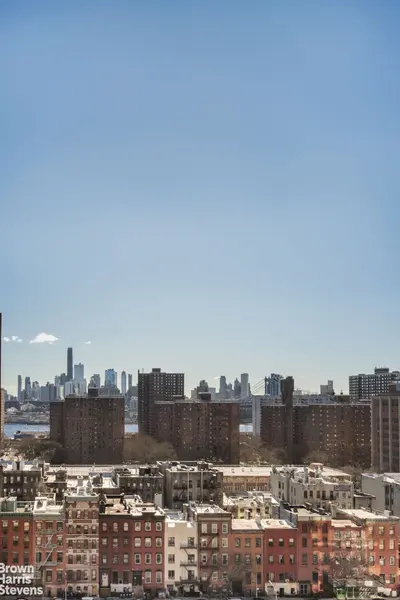
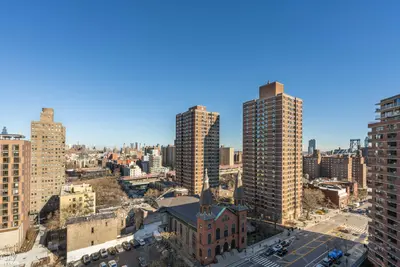
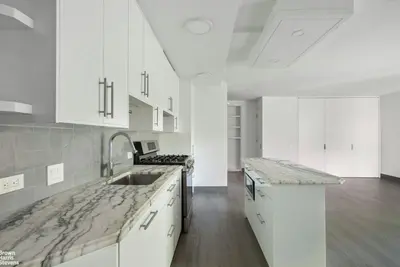
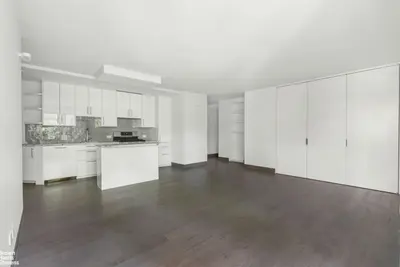
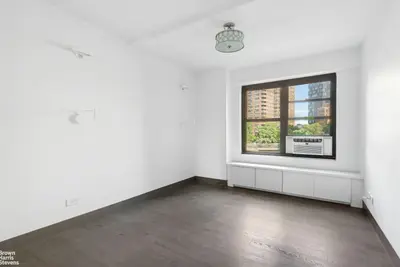
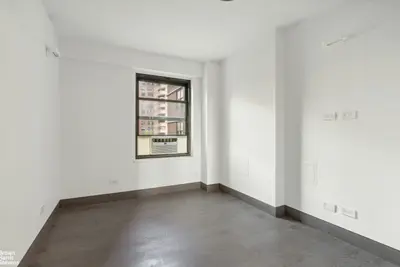
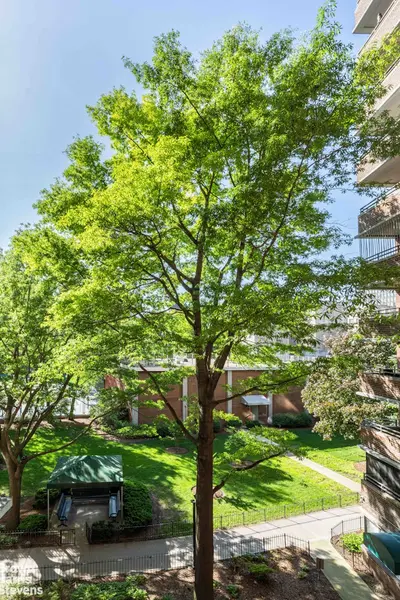
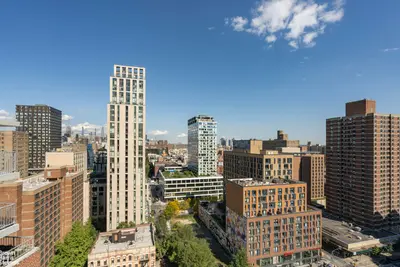
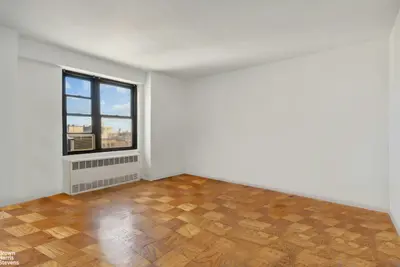

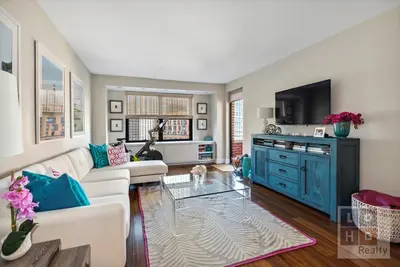


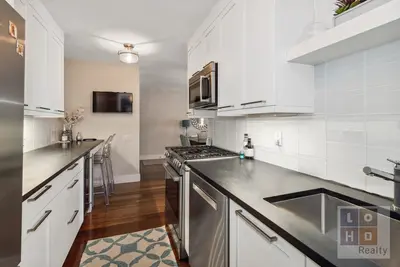


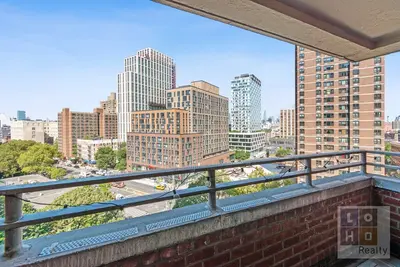


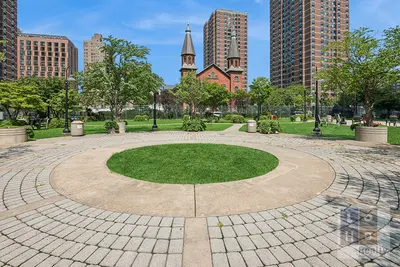
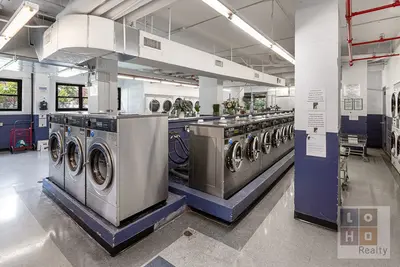

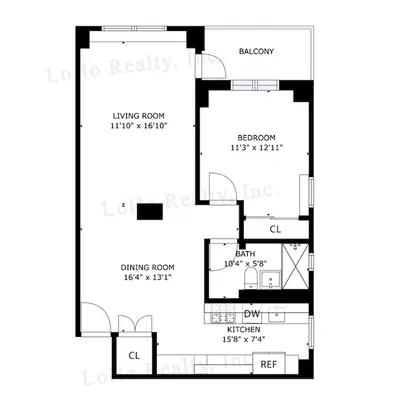
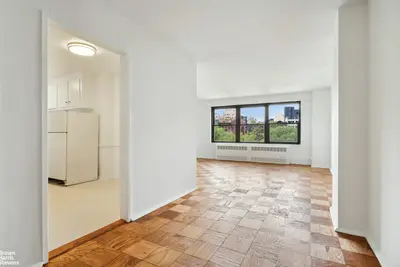
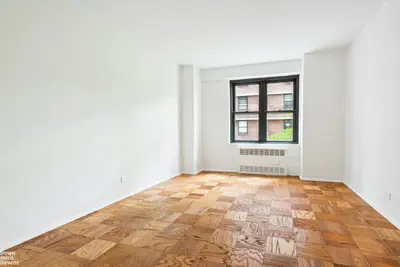
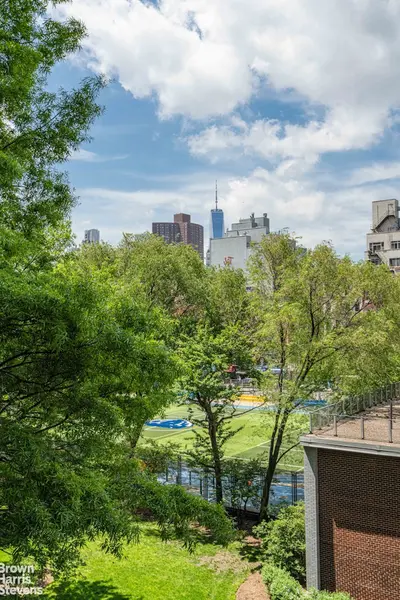
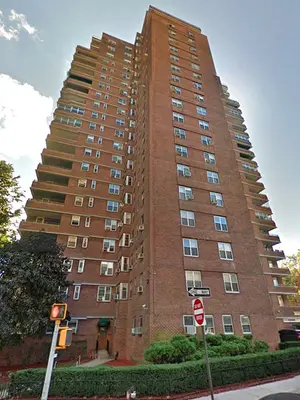
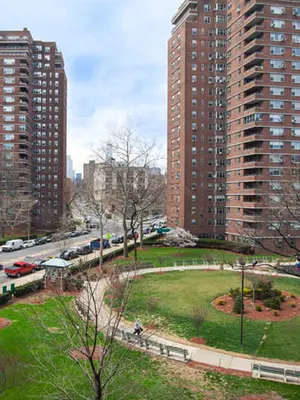
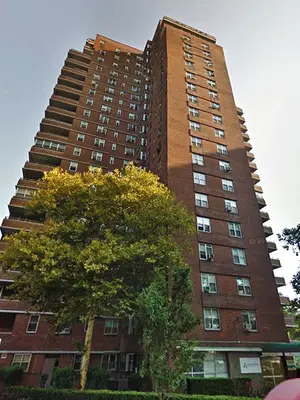
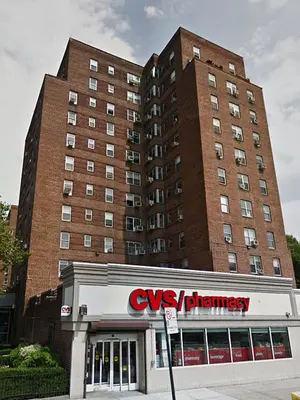
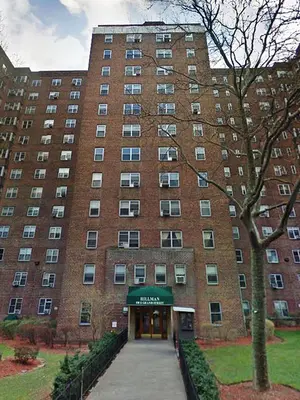
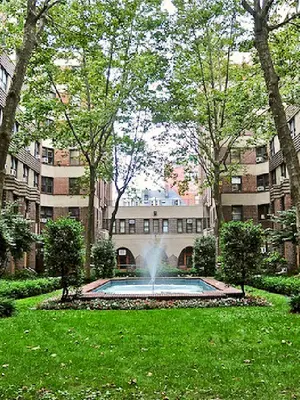
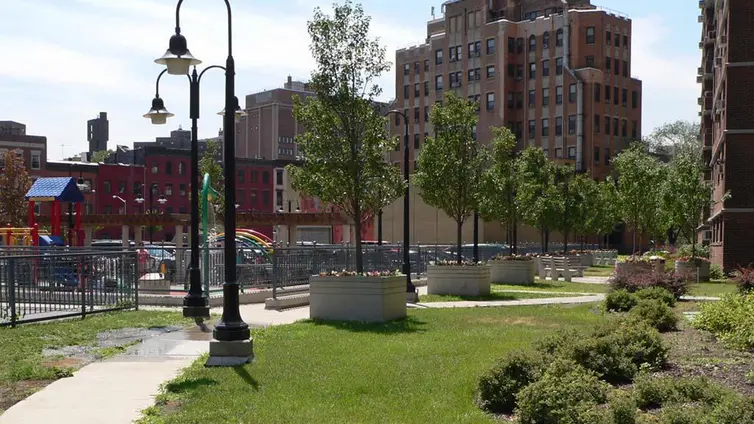
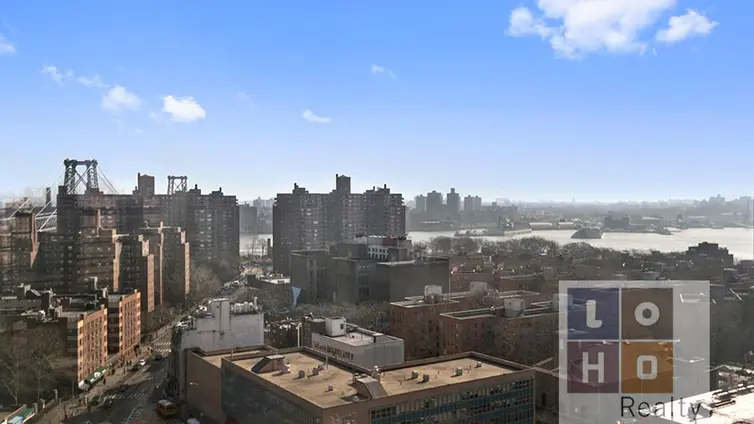
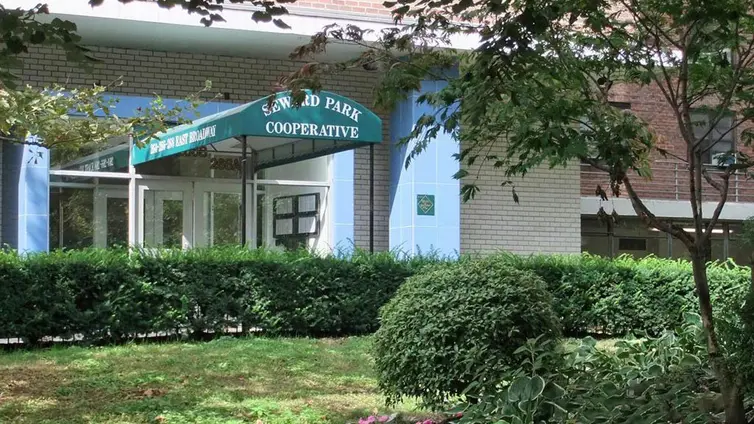
Seward Park 1-2 is situated at 417 Grand Street and part of a larger postwar cooperative complex where all residents have access to two private parks with playgrounds and water parks, not to mention a community garden. Indoor amenities and services include a 24/7 lobby attendant, on-site maintenance, fitness center, children's playroom, bike room, and community room with kitchen for events. It is a short walk from Essex Crossing and the culinary offerings of Chinatown.
Discover hidden opportunities at Seward Park (1-2)! Reach out today to learn about select off-market listings.

View school info, local attractions, transportation options & more.
Experience amazing 3D aerial maps and fly throughs.
For some co-ops, instead of price per square foot, we use an estimate of the number of rooms for each sold apartment to chart price changes over time. This is because many co-op listings do not include square footage information, and this makes it challenging to calculate accurate square-foot averages.
By displaying the price per estimated room count, we are able to provide a more reliable and consistent metric for comparing sales in the building. While we hope that this gives you a clearer sense of price trends in the building, all data should be independently verified. All data provided are only estimates and should not be used to make any purchase or sale decision.
|
Year
Avg Price / Room (Est)
Avg. Actual Price
Med. Actual Price
Transactions
2025
$249,567
$960,000
6
2024
$277,384
$902,215
30
2023
$244,797
$922,856
23
2022
$248,810
$819,365
37
2021
$252,135
$910,399
59
2020
$228,840
$846,835
29
2019
$264,172
$953,761
27
2018
$246,733
$938,839
31
2017
$238,777
$882,065
31
2016
$234,962
$881,174
46
2015
$213,040
$774,294
40
2014
$199,207
$675,757
56
|
Year
Avg Price / Room (Est)
Avg. Actual Price
Med. Actual Price
Transactions
2013
$159,750
$555,732
63
2012
$148,414
$560,814
51
2011
$156,244
$546,922
48
2010
$159,224
$566,832
31
2009
$167,813
$565,898
24
2008
$180,149
$624,022
40
2007
$160,284
$547,894
47
2006
$153,326
$530,170
56
2005
$154,583
$509,456
45
2004
$115,917
$387,257
48
2003
$82,361
$276,209
43
|
the following is a slider of images. For screen reader users, all slides are visible at all time so you may ignore control buttons.
Sign-up and we'll email you new listings in this building!
Whether you’re a buyer, investor, or simply curious, this report is your key to unlocking in-depth insights and analysis on .
Please confirm your details: