
35 Sutton Place - Beekman/Sutton Place
- Apartments
- Overview & Photos
- Maps
- Floorplans
- Sales Data & Comps
- Similar Buildings
- All Units


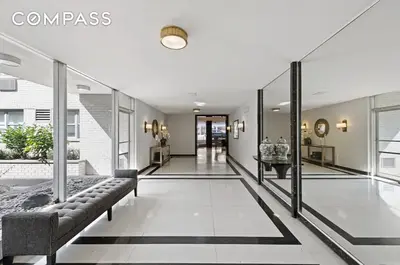


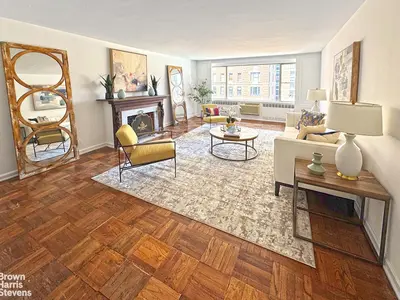
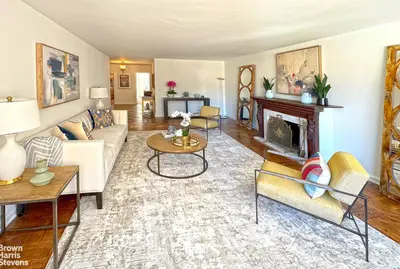
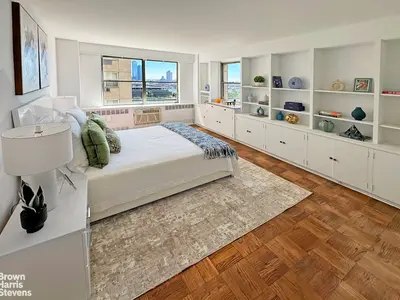
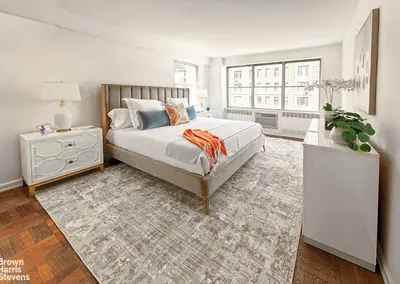
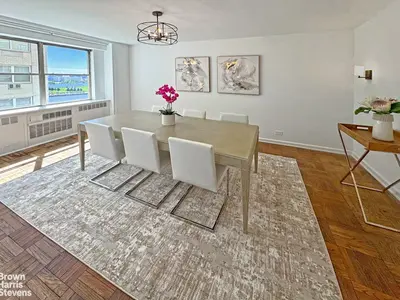
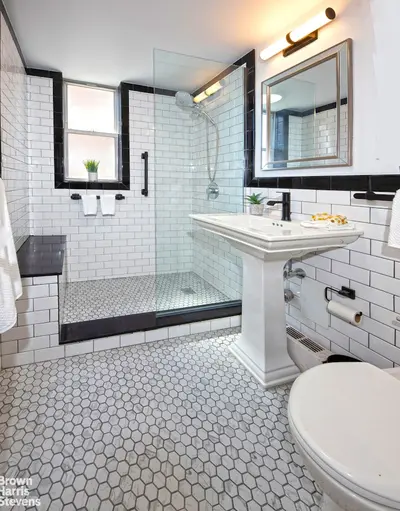
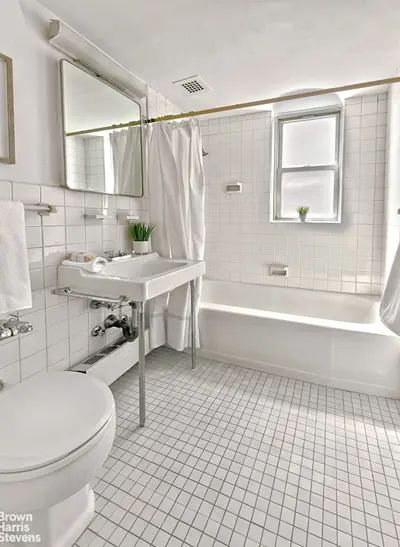
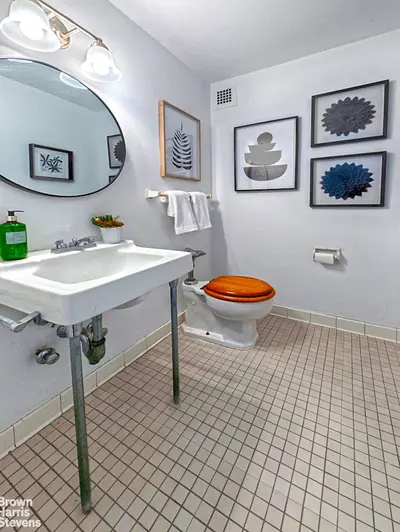


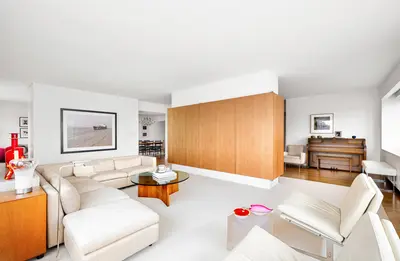


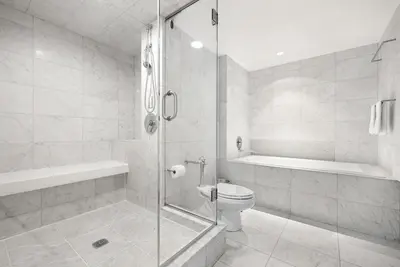


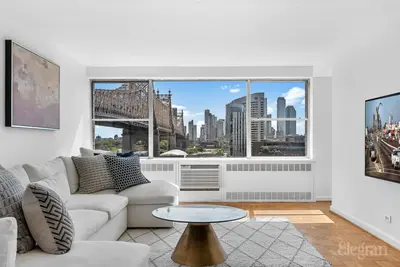
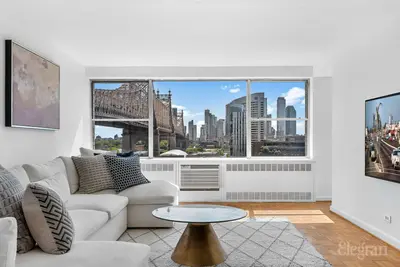
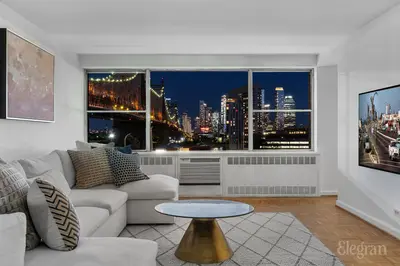
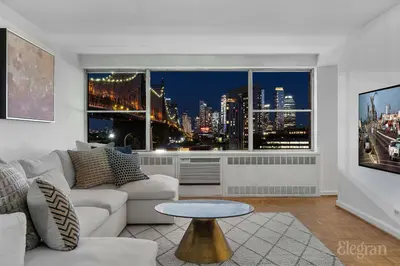
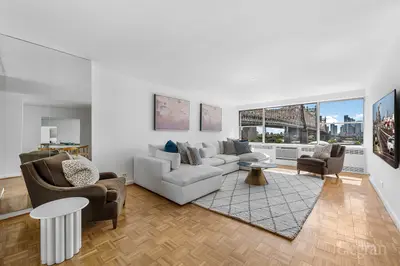

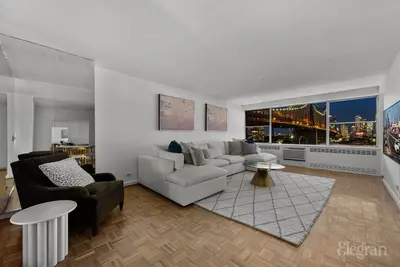


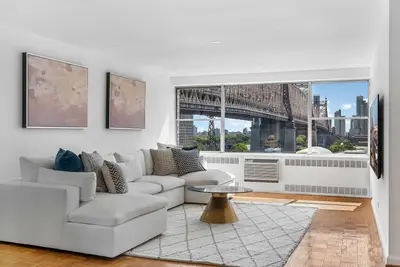
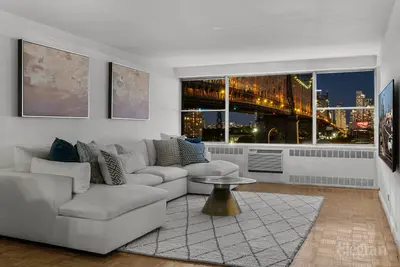
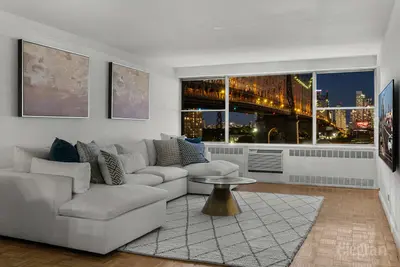
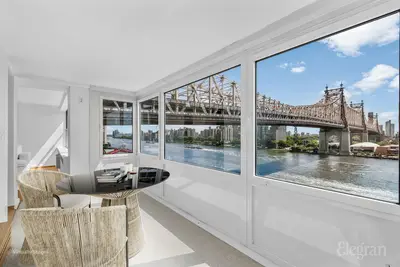

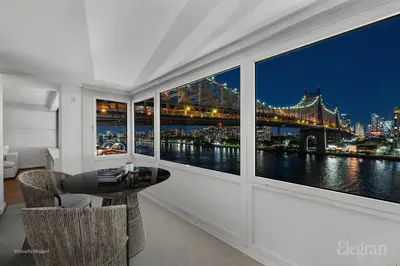
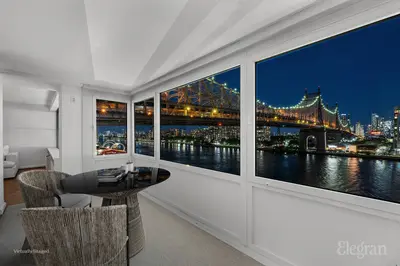


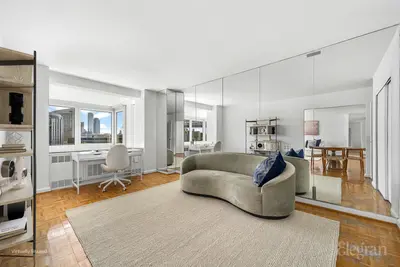
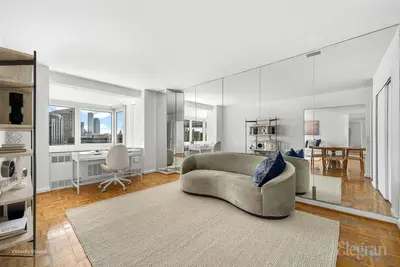


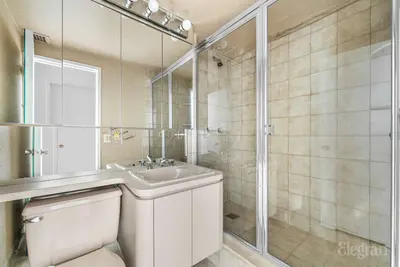
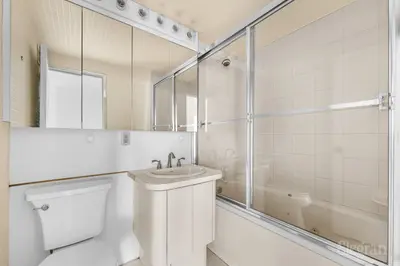
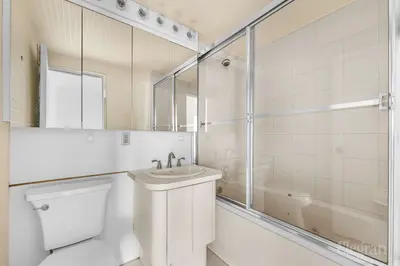


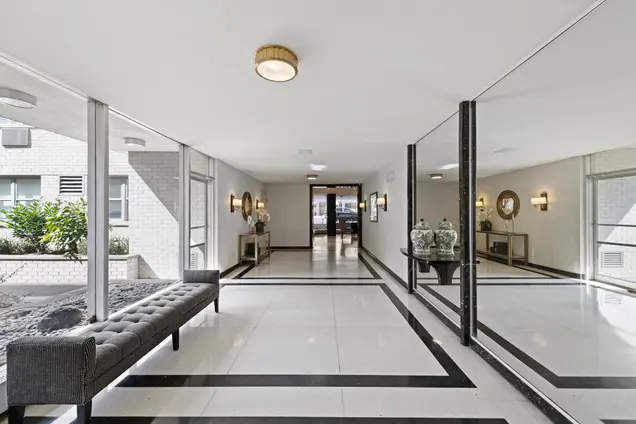
35 Sutton Place stands as a distinguished luxury cooperative in Manhattan's Beekman/Sutton Place neighborhood on the East Side. The building exemplifies white-glove service with its 24-hour doorman, concierge, attended elevators, and on-site resident manager, ensuring a high level of resident comfort and security.
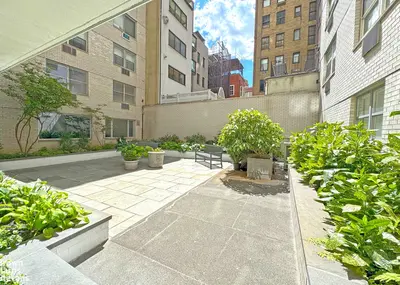
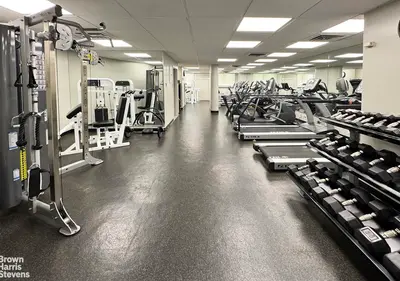
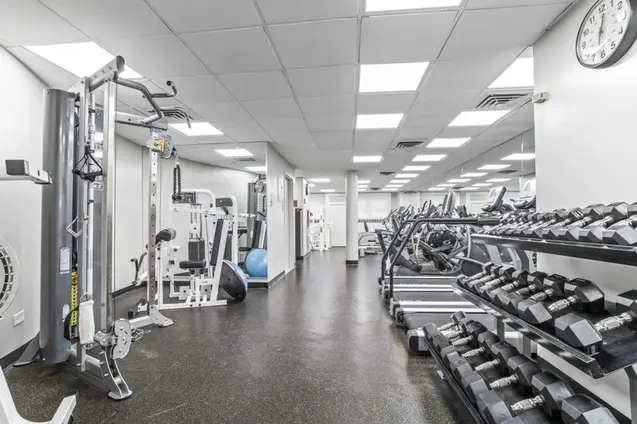
The building offers an impressive array of amenities, including a recently added roof deck that enhances the communal spaces. Residents also have access to a courtyard, gym, bike room, and laundry facilities. For those with vehicles, parking is available within the building for an additional fee.
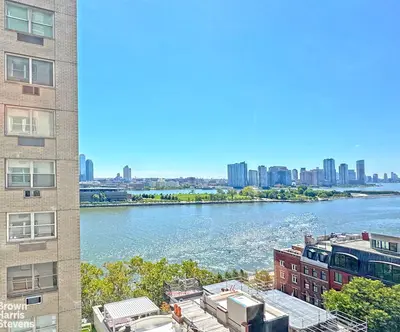
The cooperative's location provides convenient access to Whole Foods and various retail establishments in the neighborhood, making daily errands and shopping easily manageable.
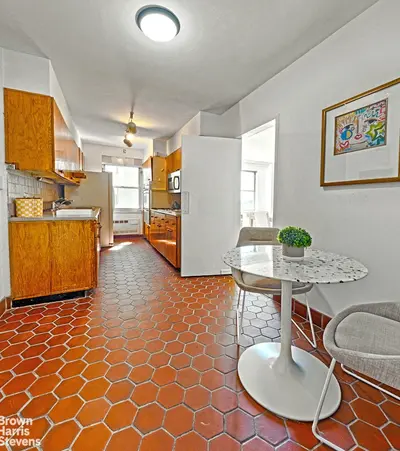
Regarding building policies, 35 Sutton Place allows washer/dryer installations in individual units with board approval. The building permits up to 60% financing for potential buyers, and there is a 2% flip tax that is paid by the purchaser. It should be noted that dogs are not permitted in the building.


View school info, local attractions, transportation options & more.
Experience amazing 3D aerial maps and fly throughs.
For some co-ops, instead of price per square foot, we use an estimate of the number of rooms for each sold apartment to chart price changes over time. This is because many co-op listings do not include square footage information, and this makes it challenging to calculate accurate square-foot averages.
By displaying the price per estimated room count, we are able to provide a more reliable and consistent metric for comparing sales in the building. While we hope that this gives you a clearer sense of price trends in the building, all data should be independently verified. All data provided are only estimates and should not be used to make any purchase or sale decision.