Shh... Many units sell without being publicly listed.
Discover hidden opportunities at The Brevoort! Reach out today to learn about select off-market listings.
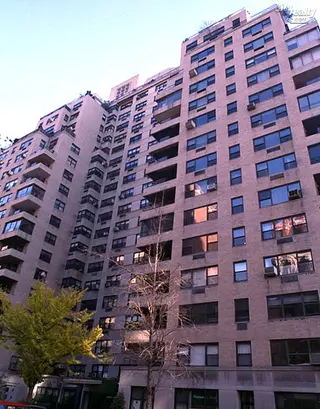
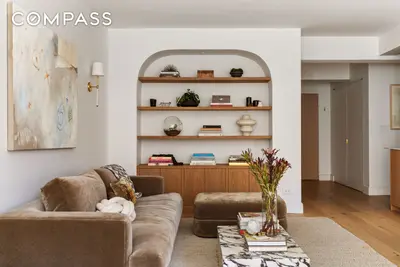
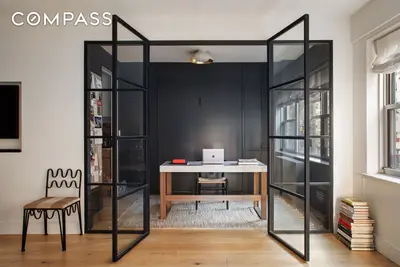
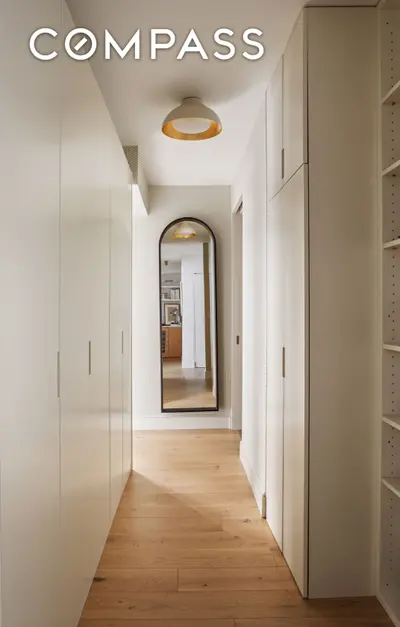


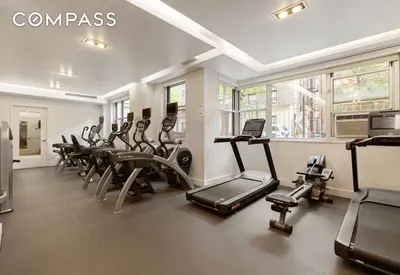
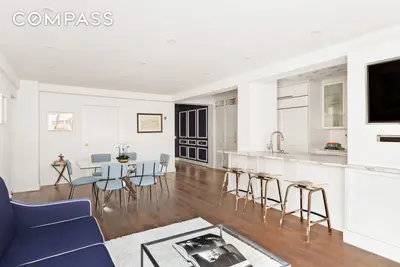
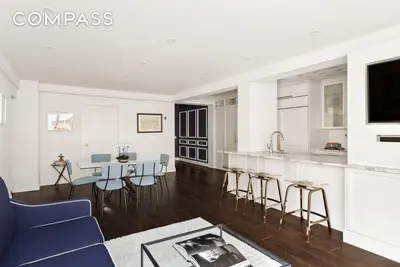
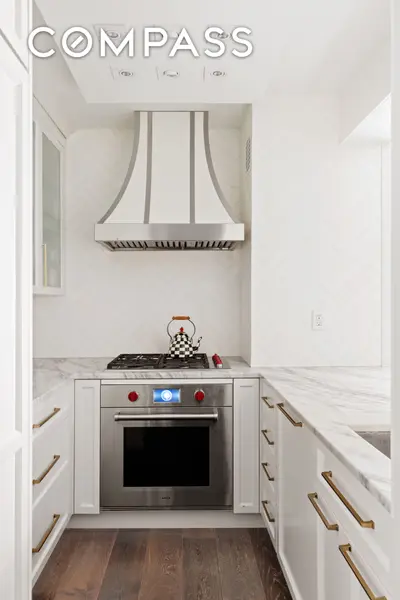
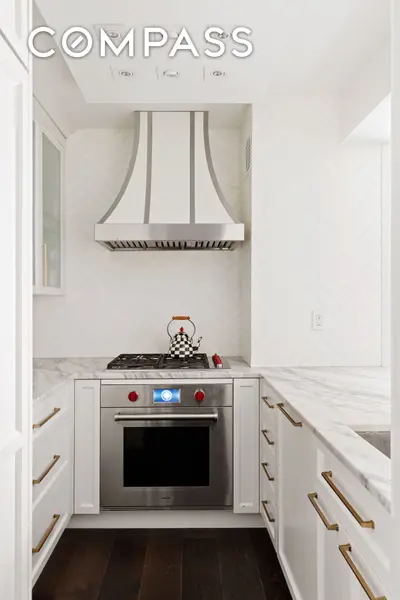
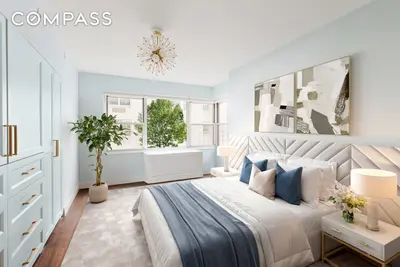
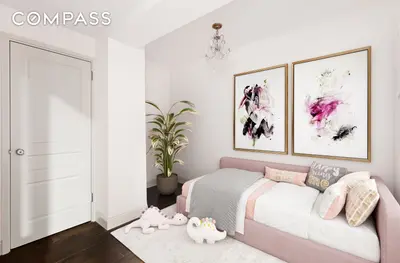
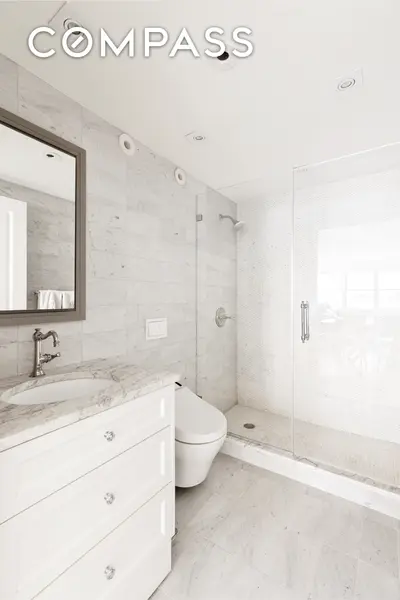
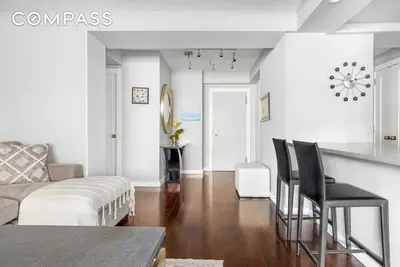
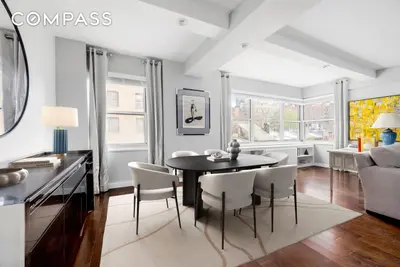
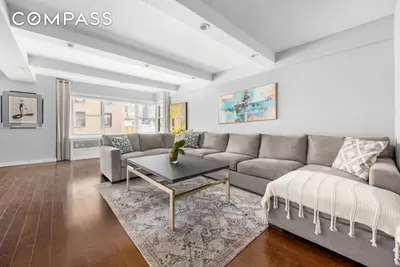
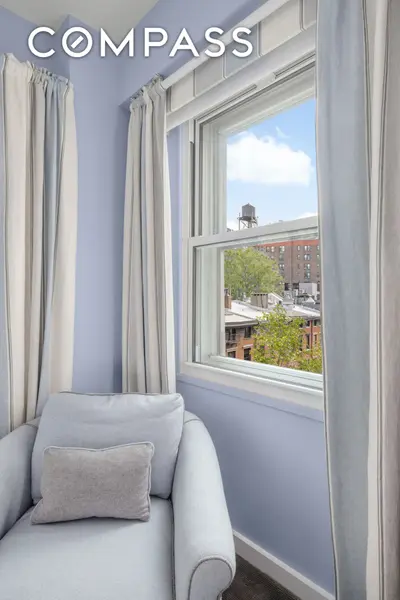
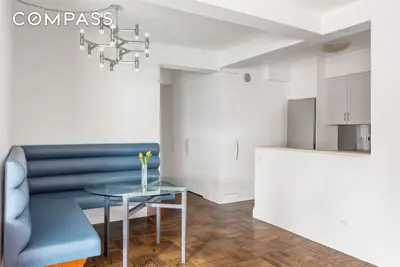
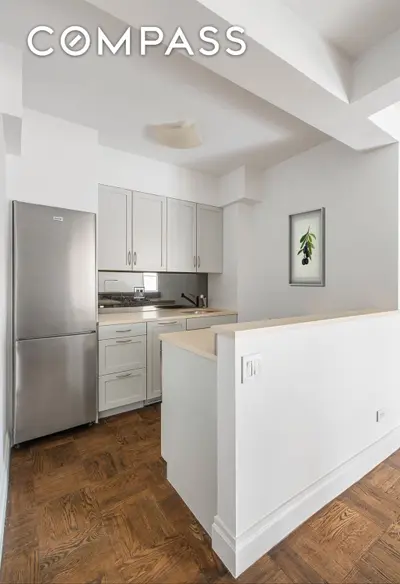
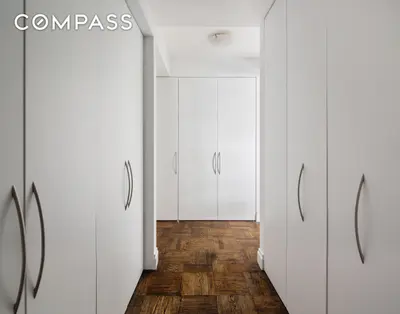
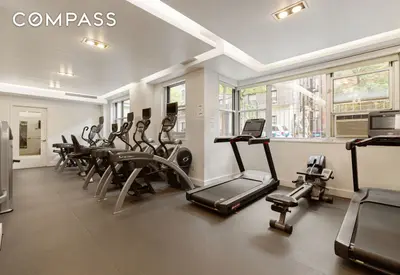
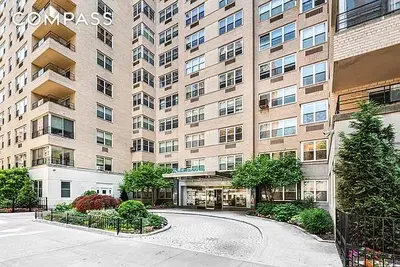
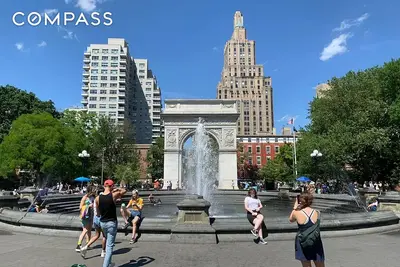
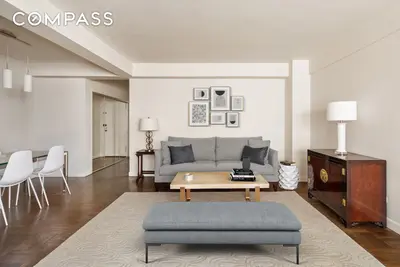

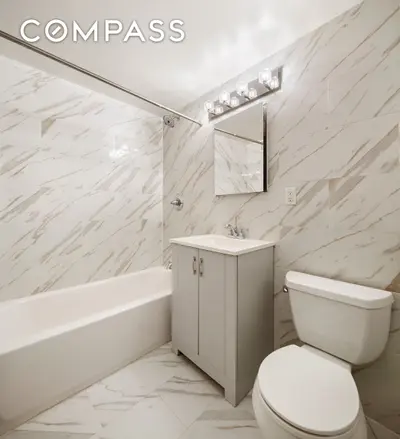
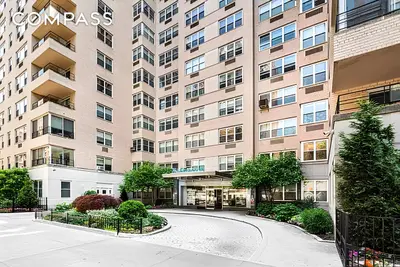
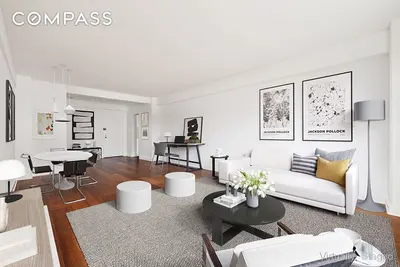
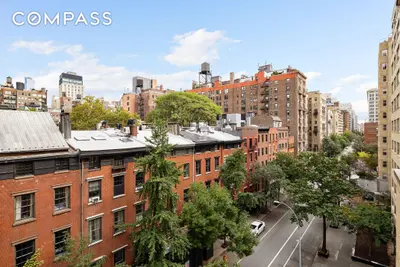
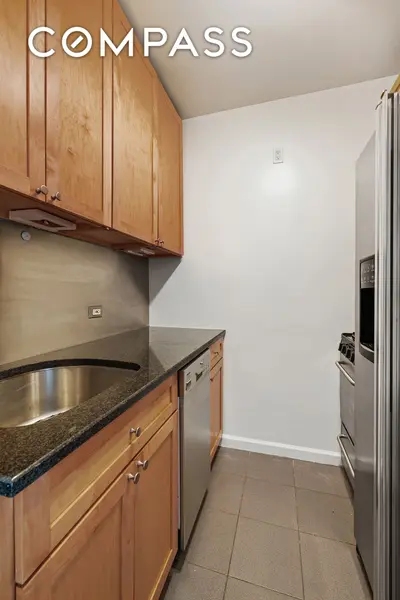
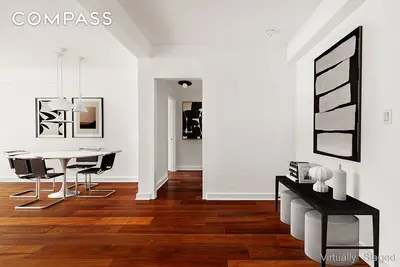
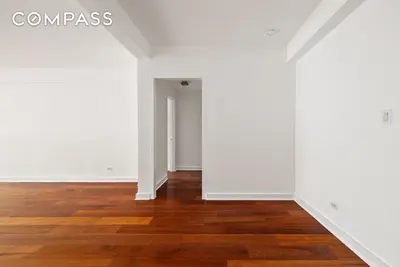
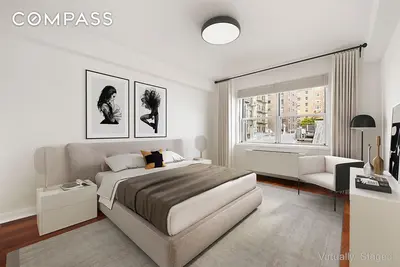
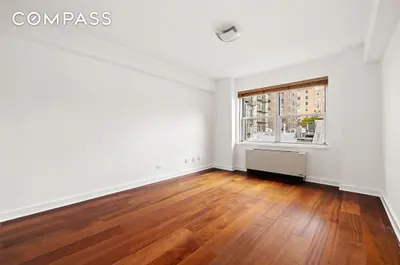
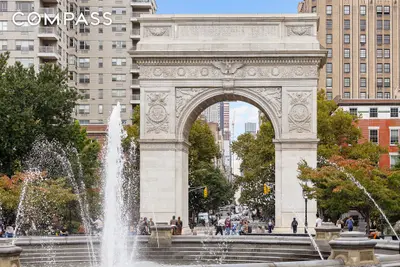
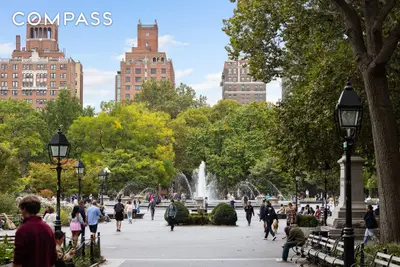
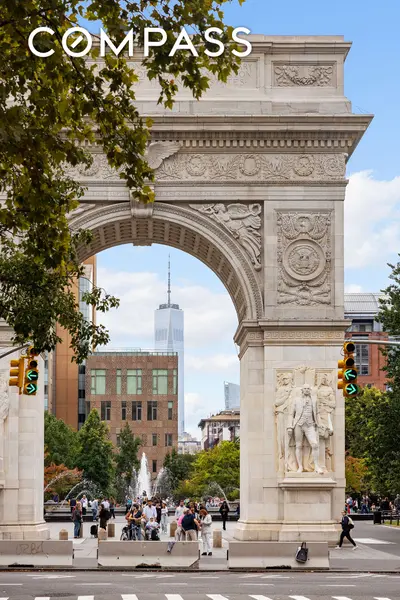
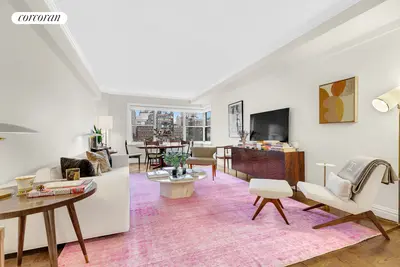
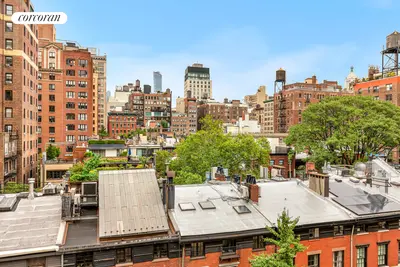
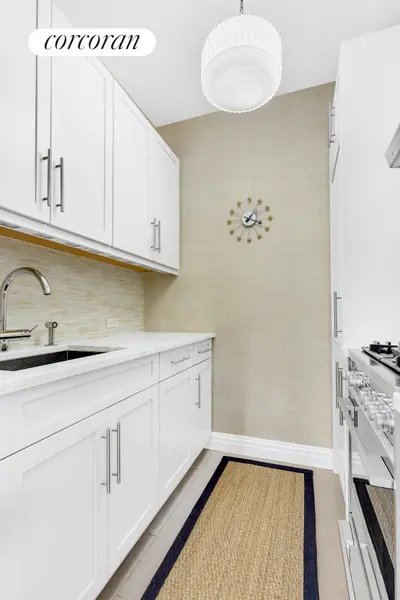
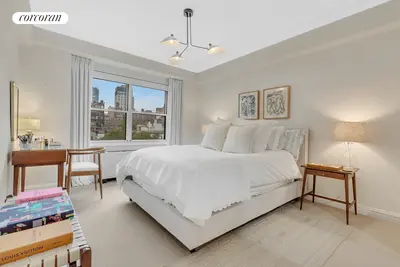
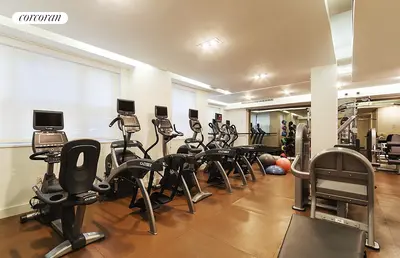
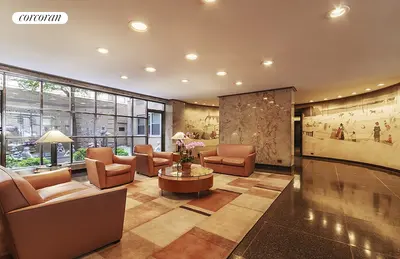
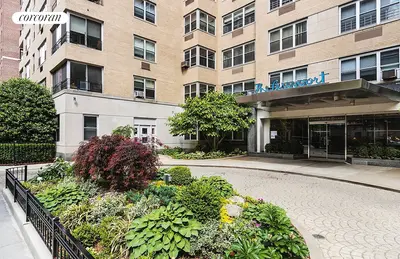
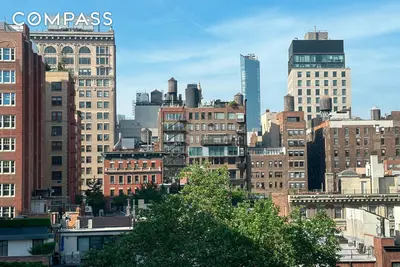
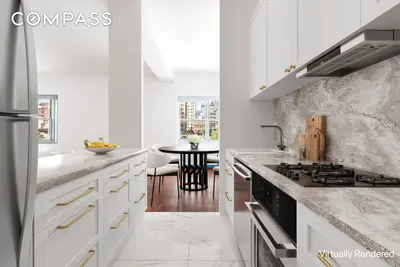
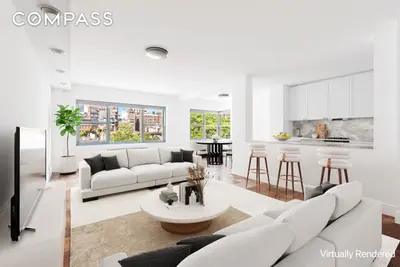
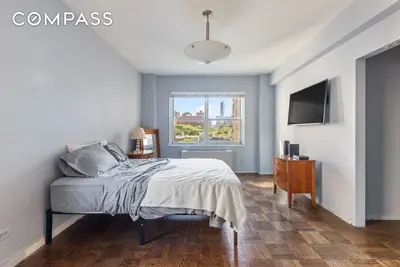
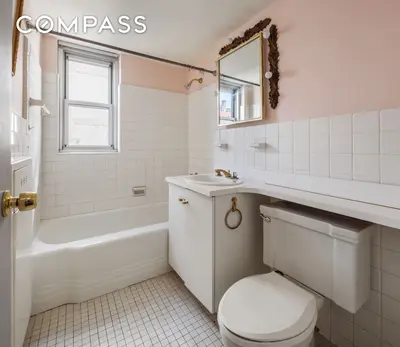
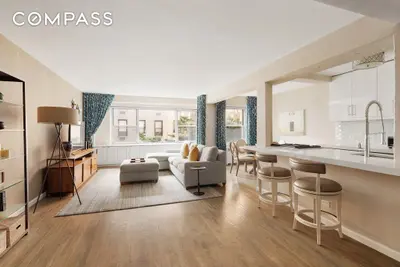
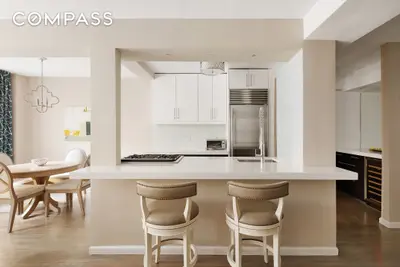
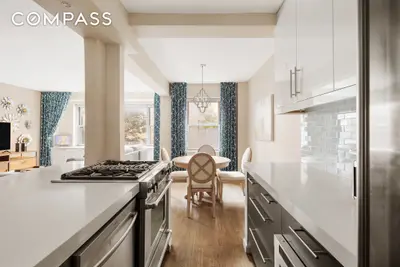
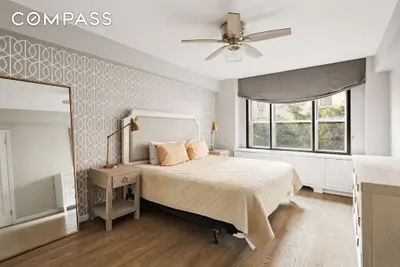
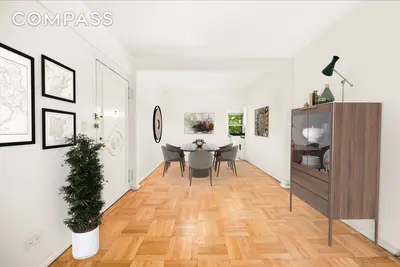
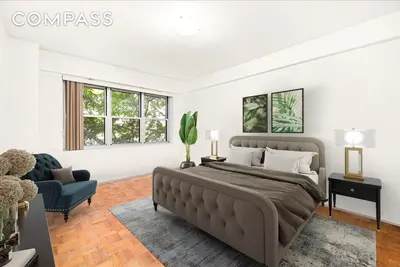
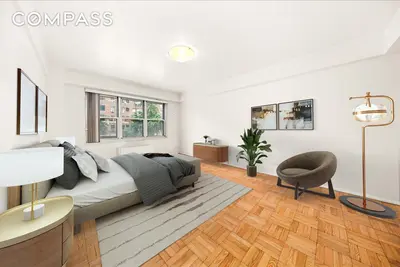
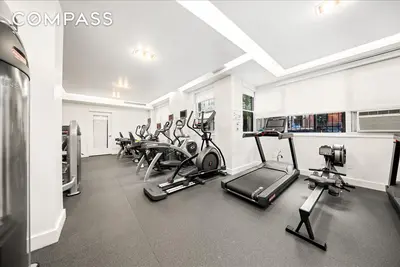
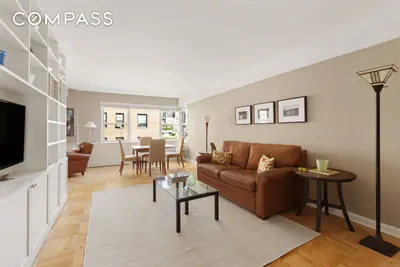
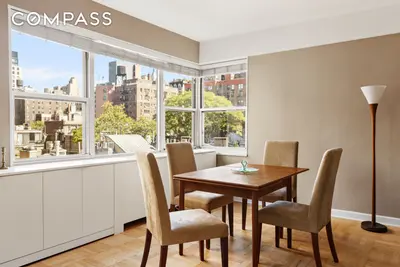
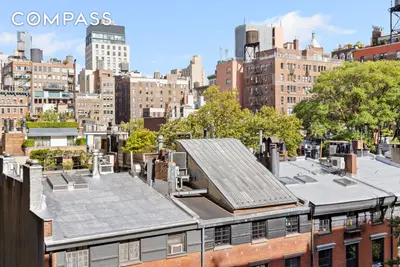
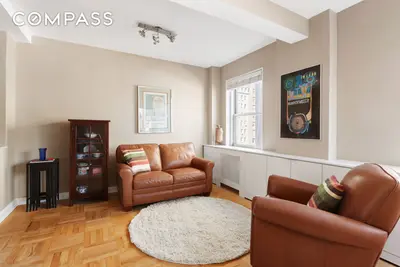
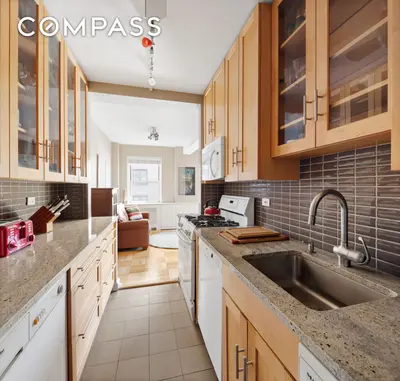
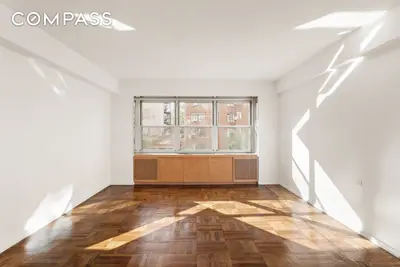
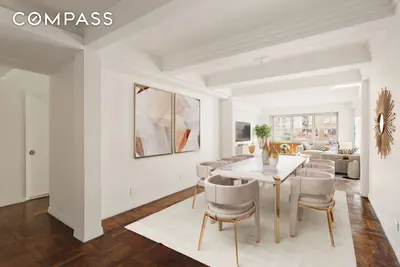
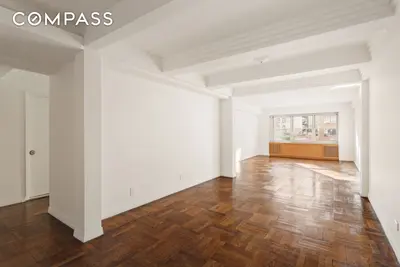
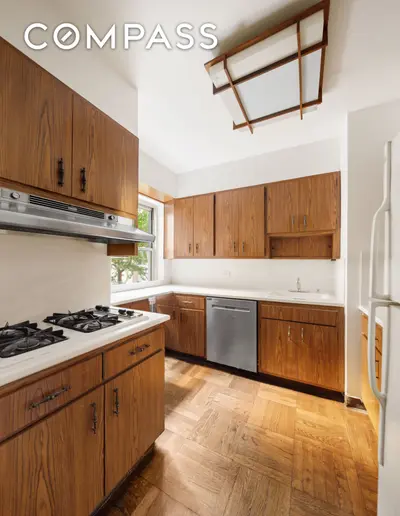
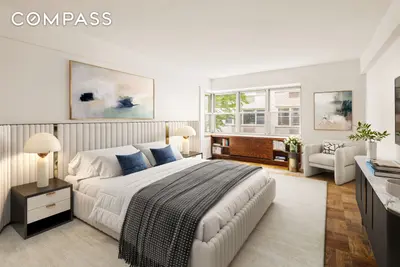
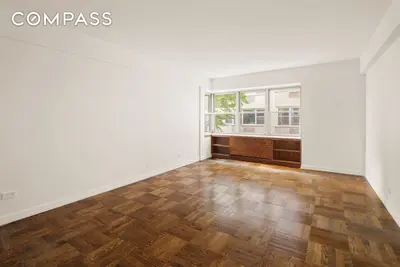
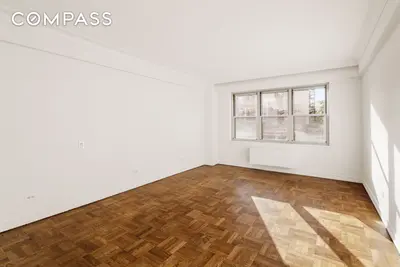

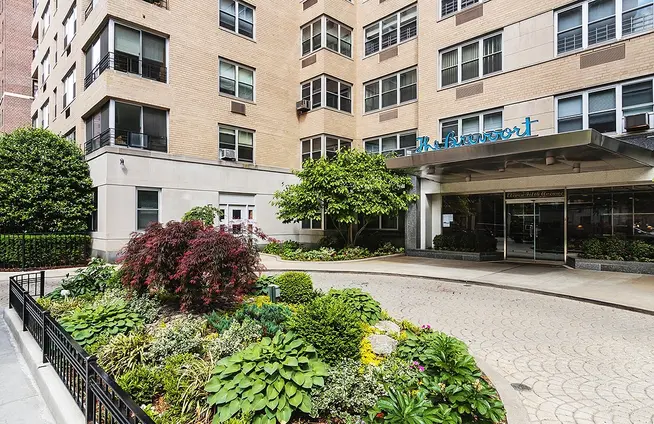
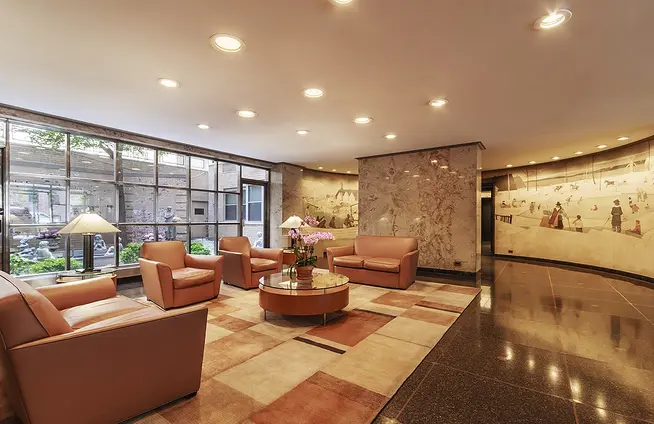
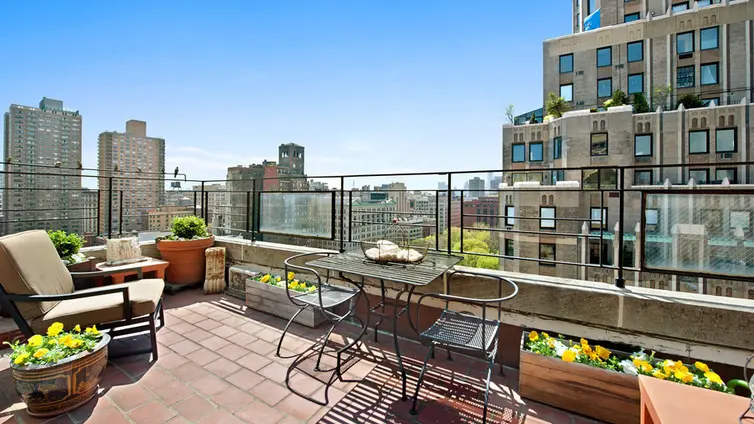
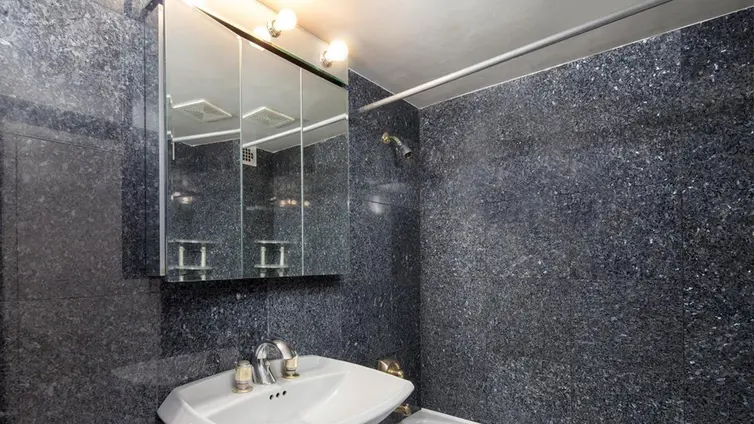
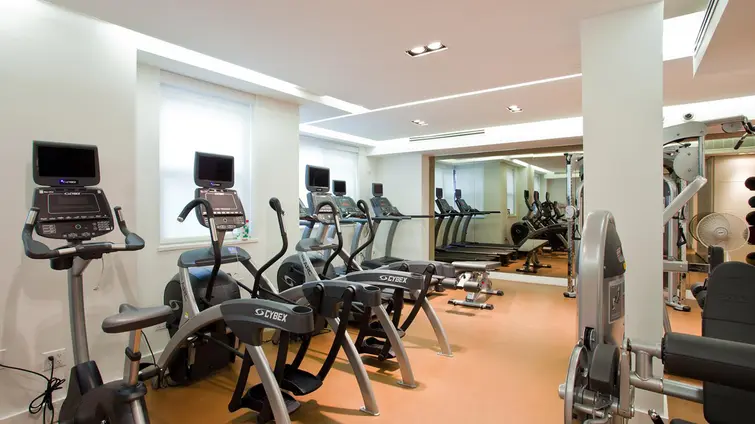
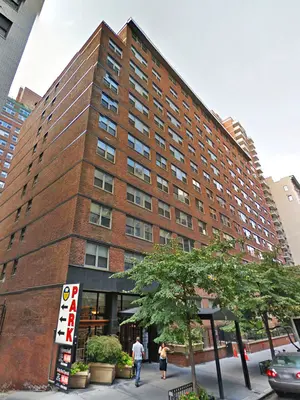
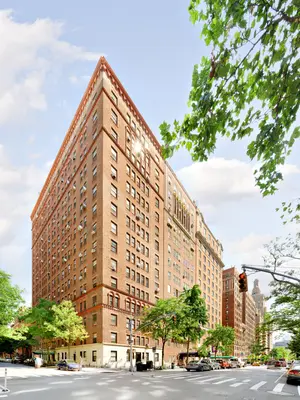
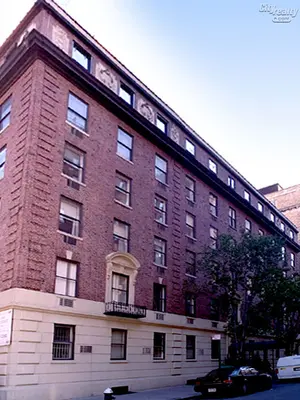
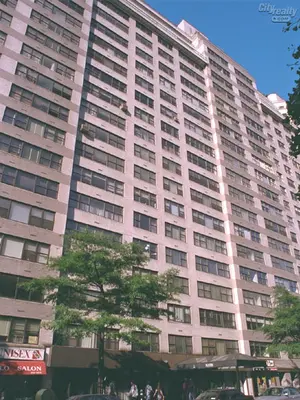
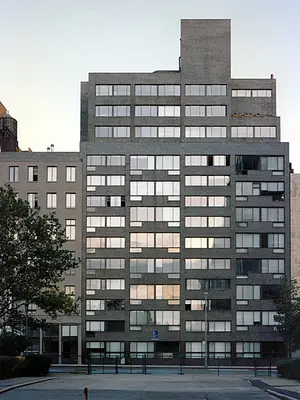
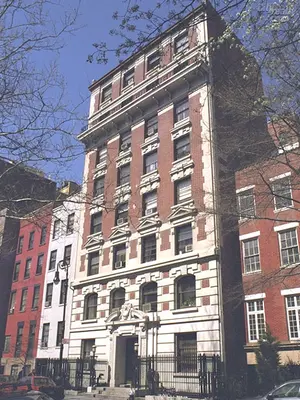
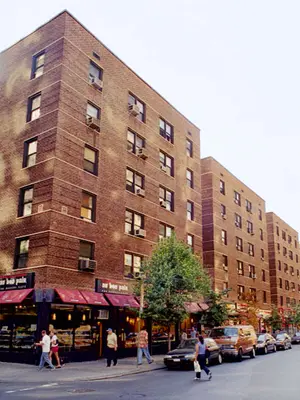
The Brevoort is a postwar cooperative located at 11 Fifth Avenue in the Gold Coast of Greenwich Village. The building has invested in numerous green features including a cogen heat engine and power station, green roof, and updated windows and electrical system. Amenities include 24-hour doorman service, concierge service, a resident manager, multiple elevators, a fitness center, resident storage, on-site laundry room, a bike room, and a parking garage. It is well situated near Washington Square Park, Union Square Park, top Greenwich Village dining and shopping, and the West 4th Street and Union Square transportation hubs.
Discover hidden opportunities at The Brevoort! Reach out today to learn about select off-market listings.

View school info, local attractions, transportation options & more.
Experience amazing 3D aerial maps and fly throughs.
For some co-ops, instead of price per square foot, we use an estimate of the number of rooms for each sold apartment to chart price changes over time. This is because many co-op listings do not include square footage information, and this makes it challenging to calculate accurate square-foot averages.
By displaying the price per estimated room count, we are able to provide a more reliable and consistent metric for comparing sales in the building. While we hope that this gives you a clearer sense of price trends in the building, all data should be independently verified. All data provided are only estimates and should not be used to make any purchase or sale decision.
|
Year
Avg Price / Room (Est)
Avg. Actual Price
Med. Actual Price
Transactions
2025
$380,500
$1,070,000
2
2024
$495,974
$2,018,813
13
2023
$504,310
$2,209,000
10
2022
$465,933
$1,837,000
10
2021
$444,800
$1,520,382
17
2020
$411,246
$1,642,222
9
2019
$495,974
$2,026,533
15
2018
$579,728
$2,950,000
7
2017
$494,148
$1,792,778
9
2016
$476,980
$1,714,164
9
2015
$541,114
$1,974,688
16
2014
$472,736
$1,955,533
15
|
Year
Avg Price / Room (Est)
Avg. Actual Price
Med. Actual Price
Transactions
2013
$332,394
$1,210,385
13
2012
$396,554
$1,669,964
14
2011
$285,395
$1,068,000
15
2010
$315,293
$1,274,164
11
2009
$286,274
$963,267
9
2008
$338,228
$1,368,889
9
2007
$341,257
$1,427,028
9
2006
$311,305
$1,159,638
10
2005
$275,818
$1,120,900
10
2004
$235,292
$699,700
10
2003
$190,883
$738,094
16
|
the following is a slider of images. For screen reader users, all slides are visible at all time so you may ignore control buttons.
Sign-up and we'll email you new listings in this building!
Whether you’re a buyer, investor, or simply curious, this report is your key to unlocking in-depth insights and analysis on .
Please confirm your details:


Broker & Buyer Comments