Shh... Many units sell without being publicly listed.
Interested in off-market listings at The Vermeer? Some previously listed residences might be available – contact us for insider details on potential opportunities!
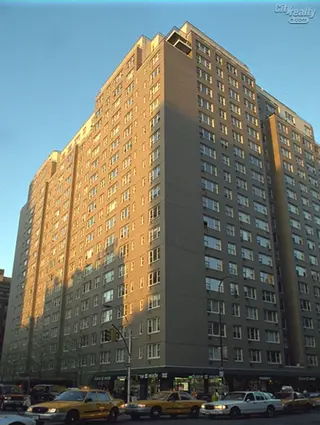
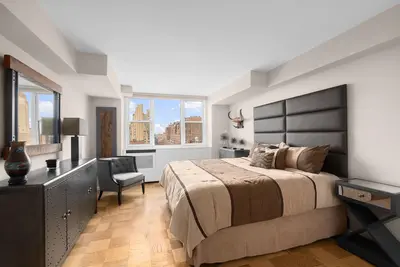
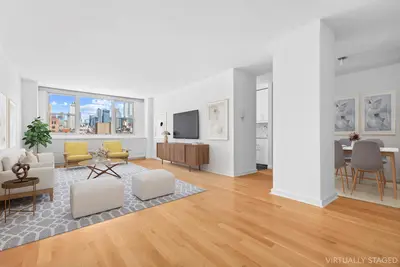

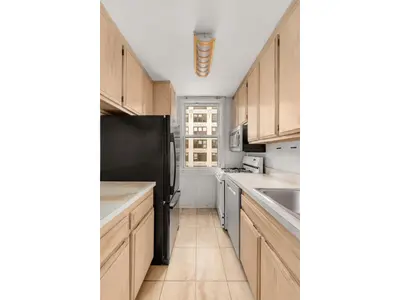

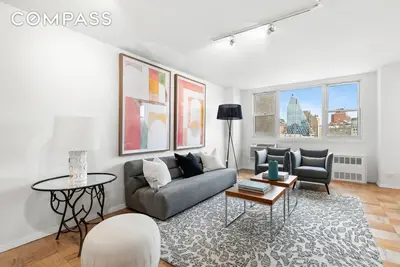

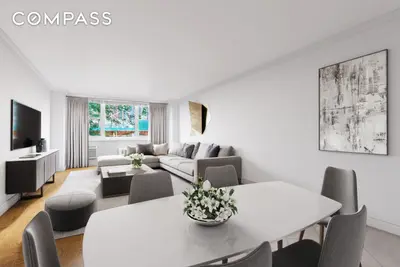
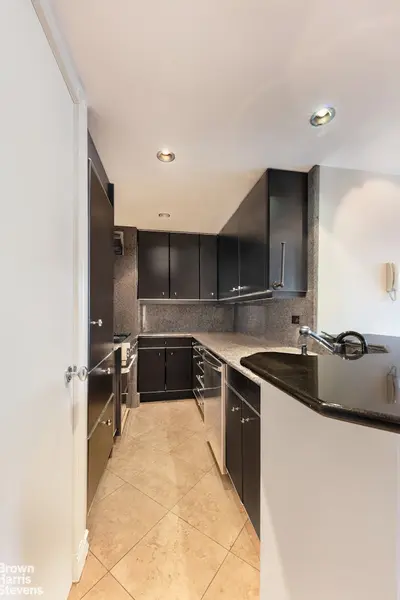
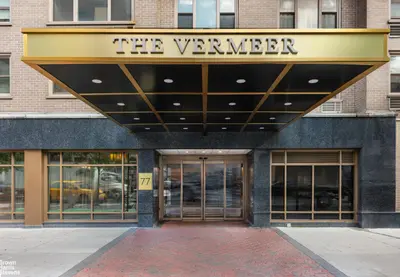


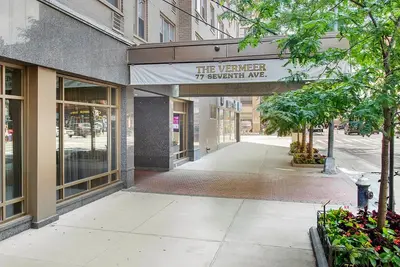
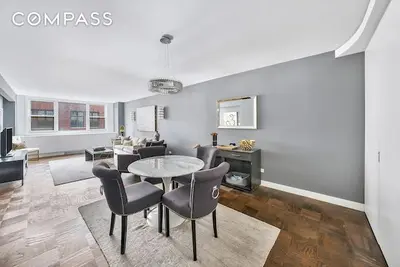
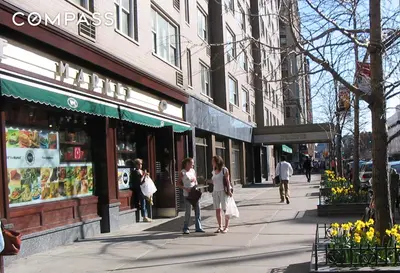
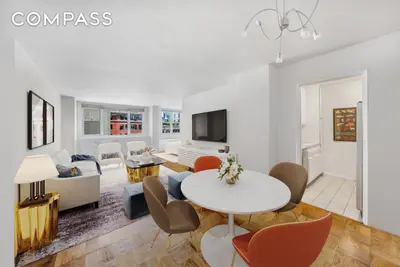
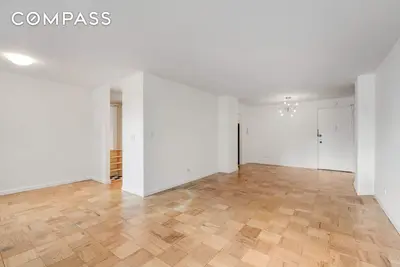
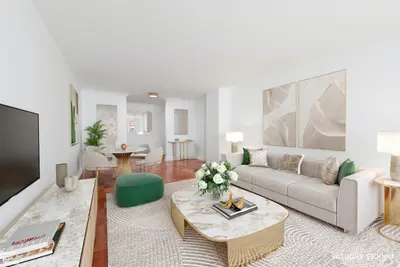
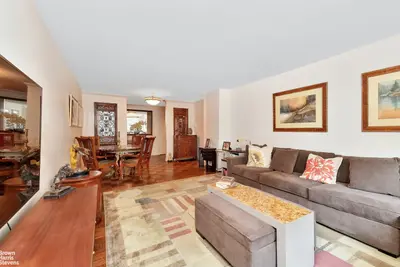
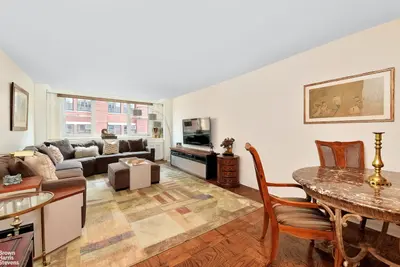
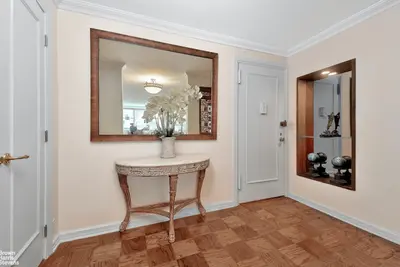
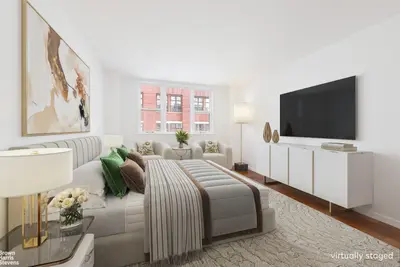

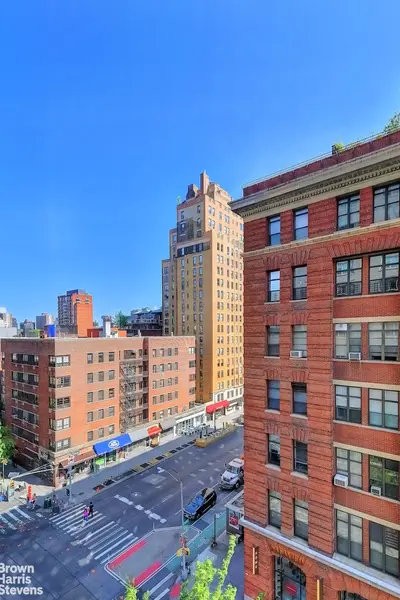
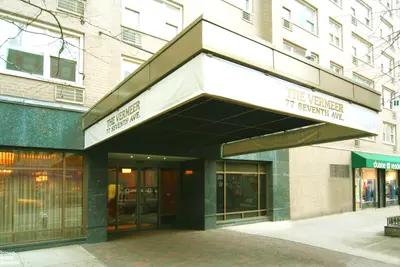
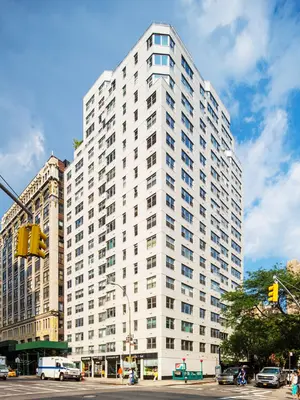
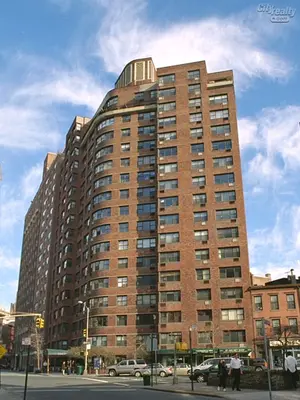
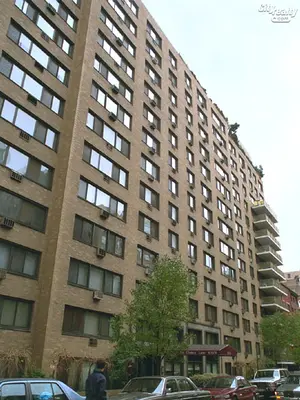
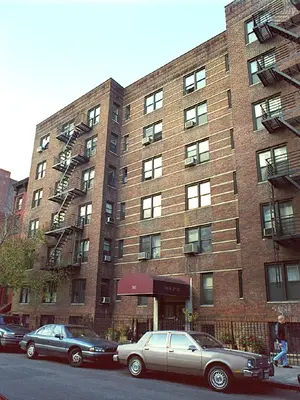
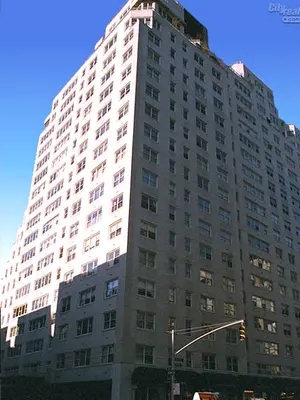
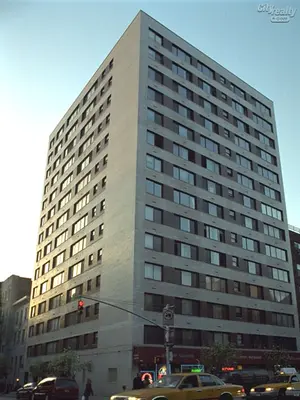
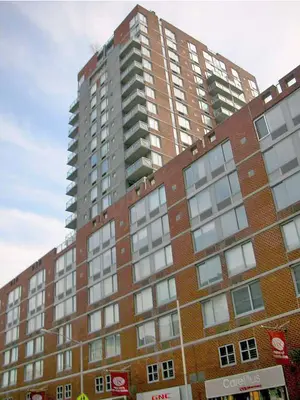
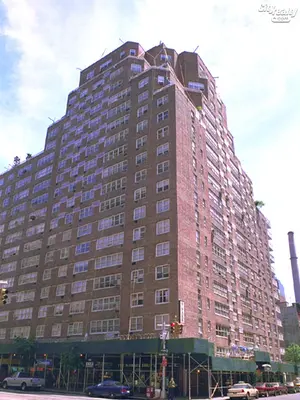
The Vermeer is a postwar cooperative dating back to 1963 and located at 77 Seventh Avenue, between West 14th and 15th Streets where Greenwich Village meets Chelsea. Popular restaurants, boutiques, nightlife, and convenient transportation are a short distance away.
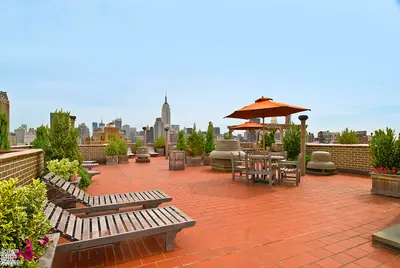
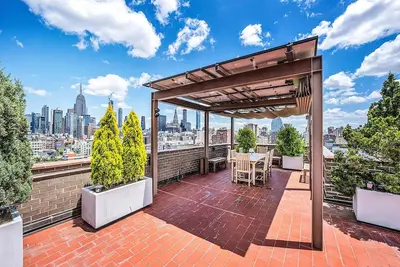
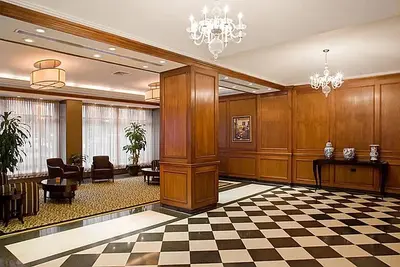
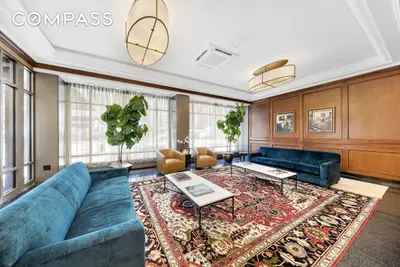
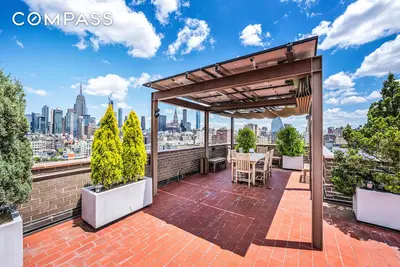
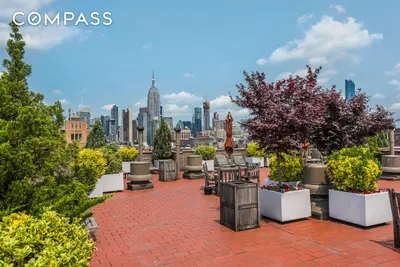
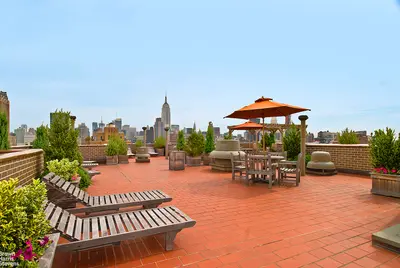
This full-service staff includes full-time door attendants, concierge, a live-in resident manager, and a staff of porters and handymen. Residents arrive to a welcoming lobby, and amenities include a bike room, a parking garage, a central laundry room, and a landscaped and furnished roof deck.
Monthly maintenance at The Vermeer includes electricity. Pets are welcome; sublets require board approval; and pied-a-terres are not permitted.
Interested in off-market listings at The Vermeer? Some previously listed residences might be available – contact us for insider details on potential opportunities!

View school info, local attractions, transportation options & more.
Experience amazing 3D aerial maps and fly throughs.
For some co-ops, instead of price per square foot, we use an estimate of the number of rooms for each sold apartment to chart price changes over time. This is because many co-op listings do not include square footage information, and this makes it challenging to calculate accurate square-foot averages.
By displaying the price per estimated room count, we are able to provide a more reliable and consistent metric for comparing sales in the building. While we hope that this gives you a clearer sense of price trends in the building, all data should be independently verified. All data provided are only estimates and should not be used to make any purchase or sale decision.
|
Year
Avg Price / Room (Est)
Avg. Actual Price
Med. Actual Price
Transactions
2025
$330,000
$1,650,000
1
2024
$323,209
$1,028,063
16
2023
$303,149
$954,762
14
2022
$355,706
$1,261,833
15
2021
$298,438
$1,120,797
19
2020
$307,636
$1,036,818
11
2019
$317,222
$1,228,429
7
2018
$308,368
$1,192,208
10
2017
$315,427
$1,016,136
11
2016
$367,885
$1,317,501
13
2015
$337,933
$1,090,050
8
2014
$292,165
$959,235
22
|
Year
Avg Price / Room (Est)
Avg. Actual Price
Med. Actual Price
Transactions
2013
$276,761
$892,740
17
2012
$235,688
$765,292
12
2011
$219,248
$707,658
14
2010
$209,548
$699,800
15
2009
$196,657
$536,286
7
2008
$227,428
$725,974
19
2007
$230,092
$769,077
13
2006
$232,711
$866,733
15
2005
$192,594
$648,333
18
2004
$149,763
$490,050
20
2003
$139,833
$444,677
22
|
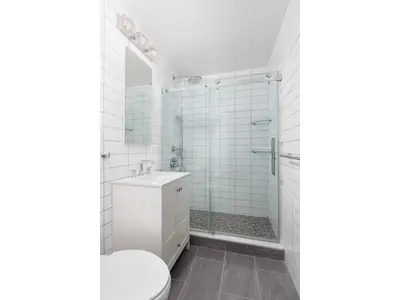
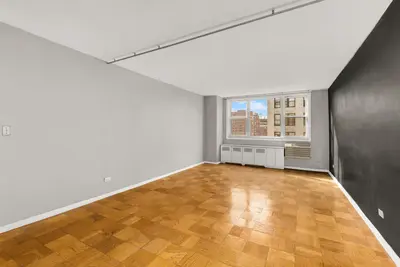
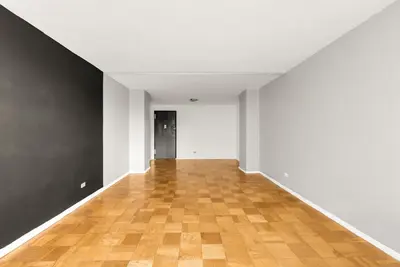
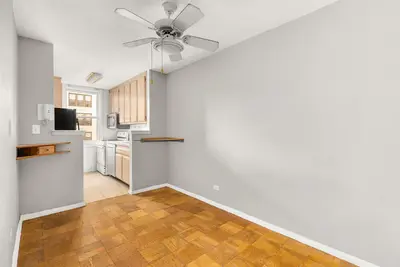
the following is a slider of images. For screen reader users, all slides are visible at all time so you may ignore control buttons.
Sign-up and we'll email you new listings in this building!
Whether you’re a buyer, investor, or simply curious, this report is your key to unlocking in-depth insights and analysis on .
Please confirm your details:

Broker & Buyer Comments