Shh... Many units sell without being publicly listed.
Limited off-market opportunities might be available at The Waverly – ideal for those looking to explore listings not currently on the market. Contact us to learn more.
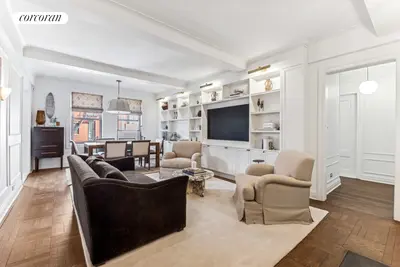
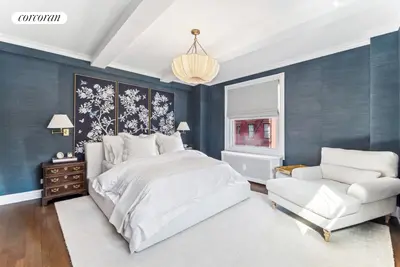
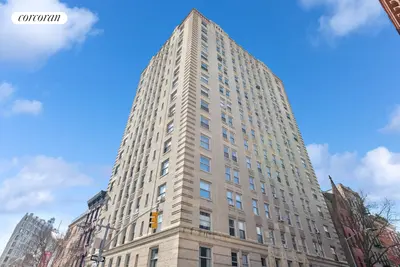
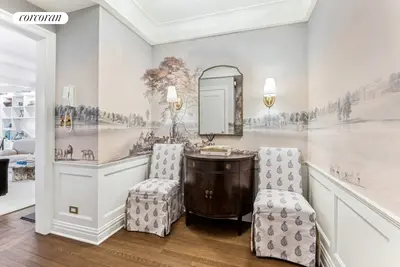
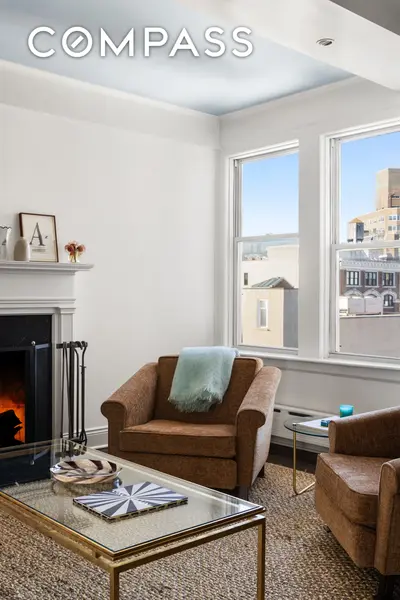
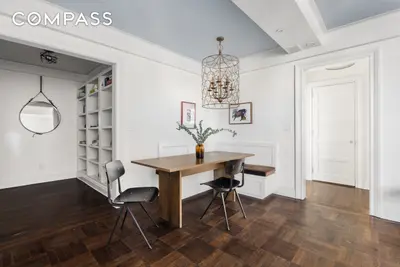
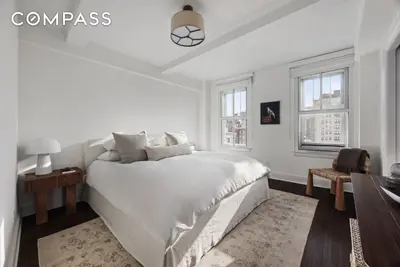
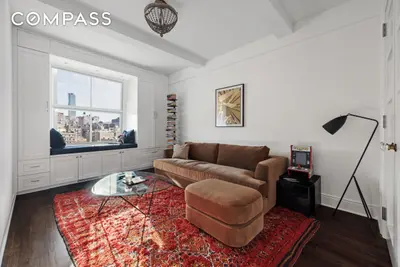
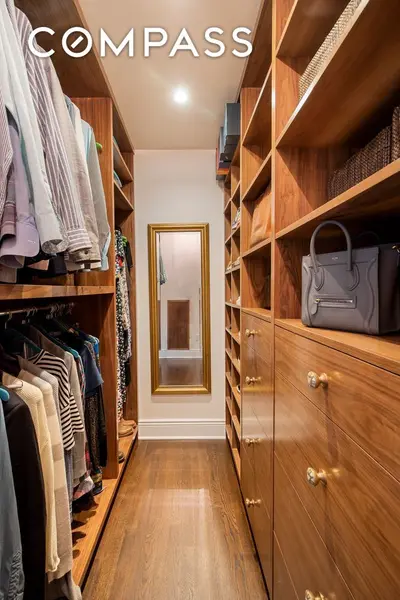
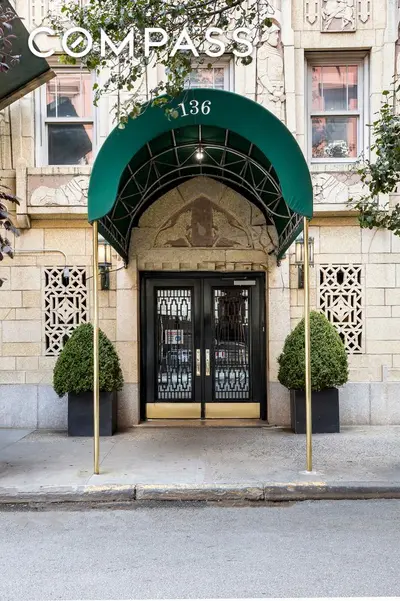
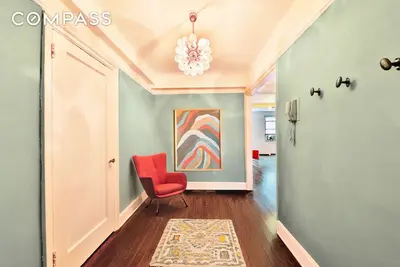
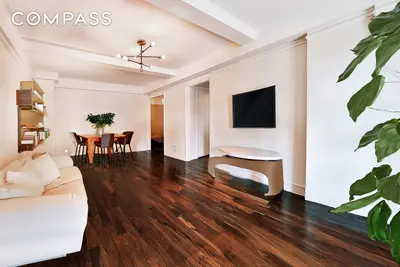
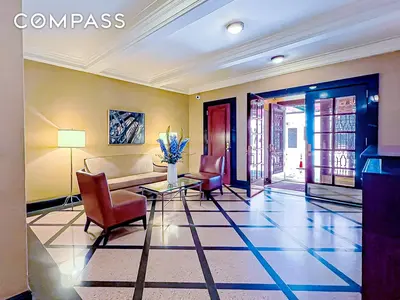
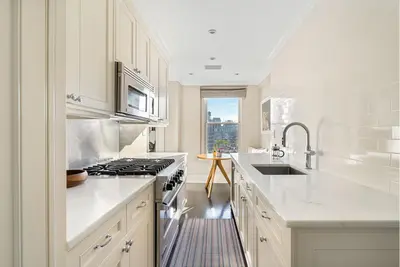
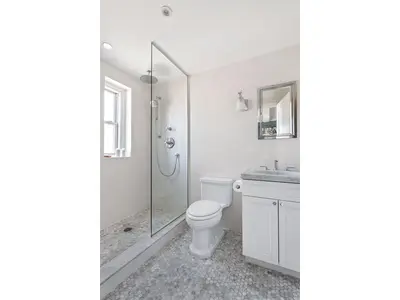
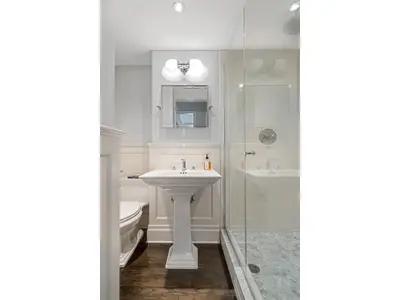

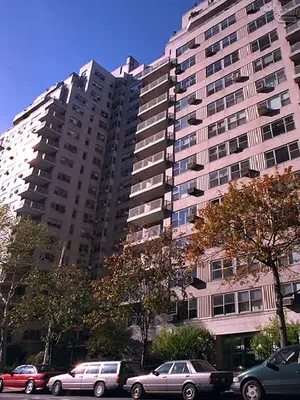
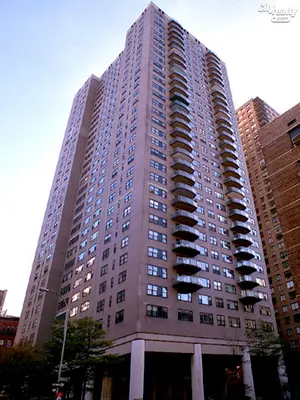
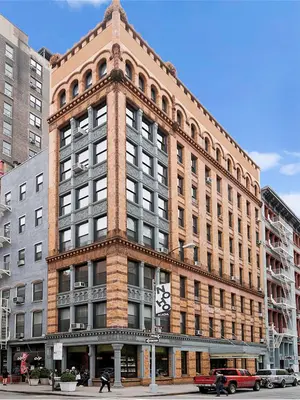
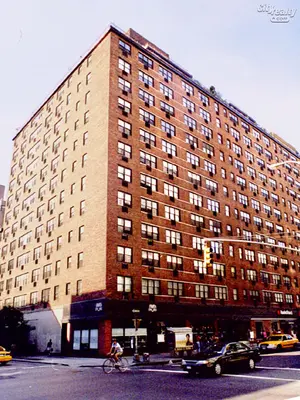
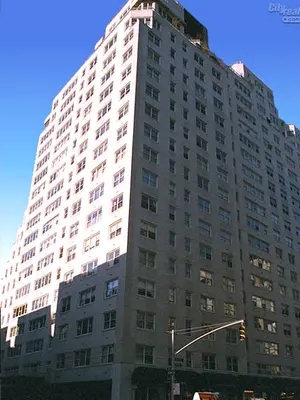
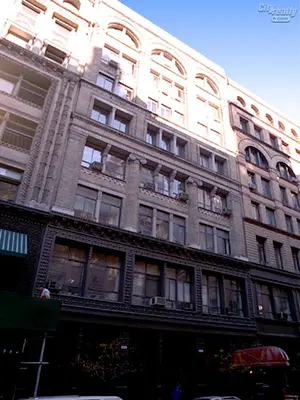
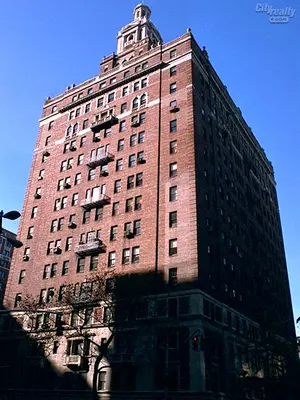
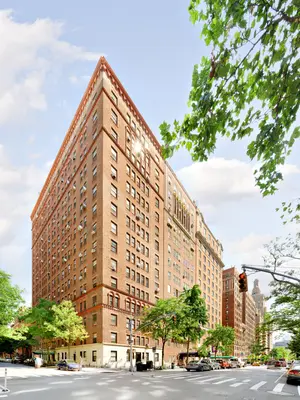
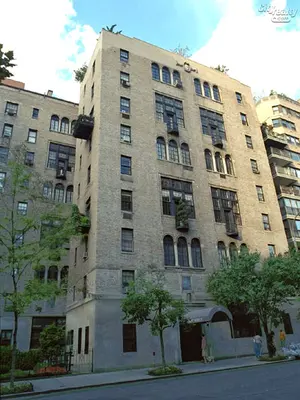
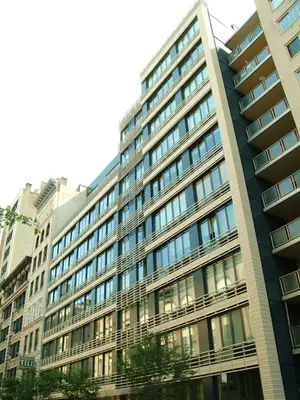
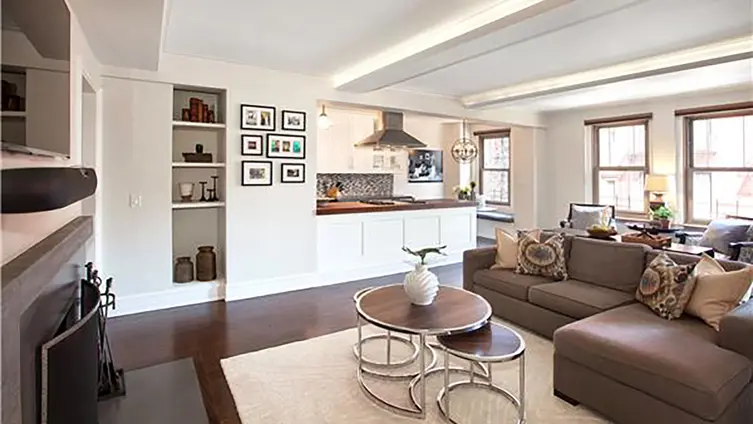
The Waverly is a pre-war cooperative built in 1928 and located within the Greenwich Village Historic District. This full service building includes a 24-hour doorman and a resident manager and comes complete with a central laundry facility, resident storage units, and bike storage.
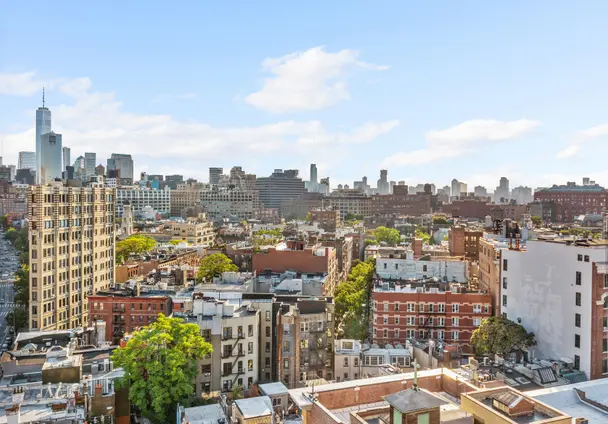
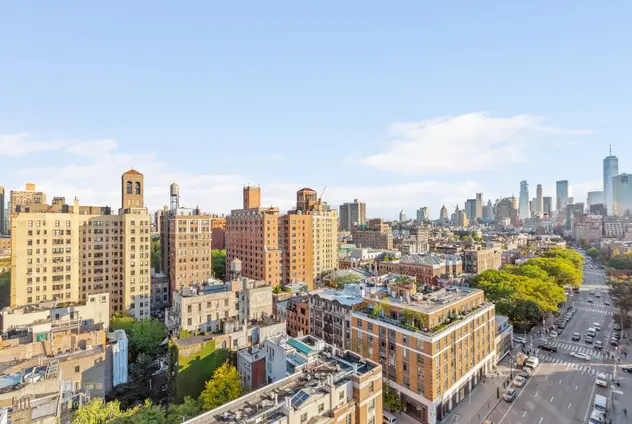
One will lead an absolutely charmed existence between this refined building and the enchanting neighborhood which surrounds it. It is mere minutes away from the Jefferson Market Garden, Washington Square Park, and a short distance to The Hudson River Park and the Highline. Conveniently the West 4th St A/C/E/B/D/F/M station is across the street, and the Christopher St 1 train station is less than two blocks away. The building is pet friendly, and co-purchasers and guarantors are considered ona case by case basis.
Limited off-market opportunities might be available at The Waverly – ideal for those looking to explore listings not currently on the market. Contact us to learn more.

View school info, local attractions, transportation options & more.
Experience amazing 3D aerial maps and fly throughs.
For some co-ops, instead of price per square foot, we use an estimate of the number of rooms for each sold apartment to chart price changes over time. This is because many co-op listings do not include square footage information, and this makes it challenging to calculate accurate square-foot averages.
By displaying the price per estimated room count, we are able to provide a more reliable and consistent metric for comparing sales in the building. While we hope that this gives you a clearer sense of price trends in the building, all data should be independently verified. All data provided are only estimates and should not be used to make any purchase or sale decision.
|
Year
Avg Price / Room (Est)
Avg. Actual Price
Med. Actual Price
Transactions
2025
$605,000
$3,025,000
1
2024
$450,000
$1,800,000
1
2023
$453,750
$1,428,333
6
2022
$592,222
$1,976,667
3
2021
$673,542
$2,694,167
3
2020
$480,556
$1,908,333
3
2019
$433,333
$1,050,000
3
2018
$515,524
$2,407,500
4
2017
$520,833
$1,562,500
2
2016
$499,333
$1,823,625
8
2015
$451,111
$1,353,333
3
2014
$363,542
$1,090,625
4
|
Year
Avg Price / Room (Est)
Avg. Actual Price
Med. Actual Price
Transactions
2013
$580,194
$2,287,700
5
2012
$388,750
$1,166,250
4
2011
$290,938
$974,375
4
2010
$357,153
$1,455,833
6
2009
$249,750
$860,500
2
2008
$375,889
$1,621,667
3
2007
$594,833
$3,509,975
3
2006
$275,500
$1,377,500
1
2005
$261,867
$934,333
3
2004
$202,500
$607,500
3
2003
$190,271
$751,000
4
|
the following is a slider of images. For screen reader users, all slides are visible at all time so you may ignore control buttons.
Sign-up and we'll email you new listings in this building!
Whether you’re a buyer, investor, or simply curious, this report is your key to unlocking in-depth insights and analysis on .
Please confirm your details: