Learn more about off-market listings at Waverly Mews!
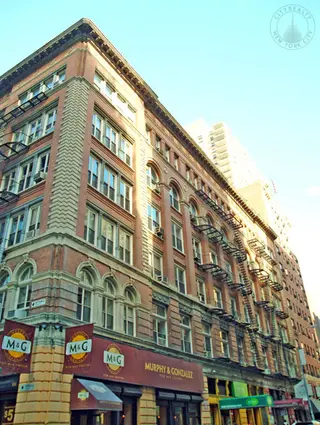
Waverly Mews, 23 Waverly Place
Doorman Co-Op in Greenwich Village
- Apartments
- Overview & Photos
- Maps
- Floorplans
- Sales Data & Comps
- Similar Buildings
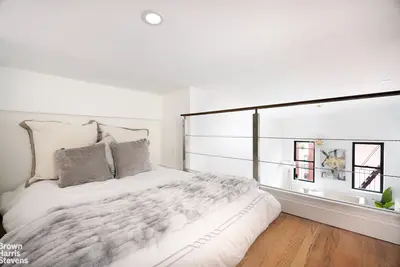
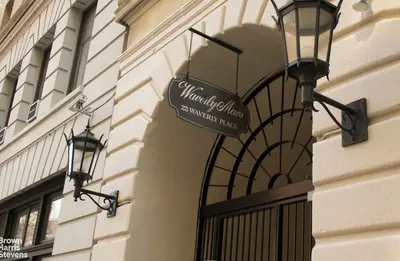
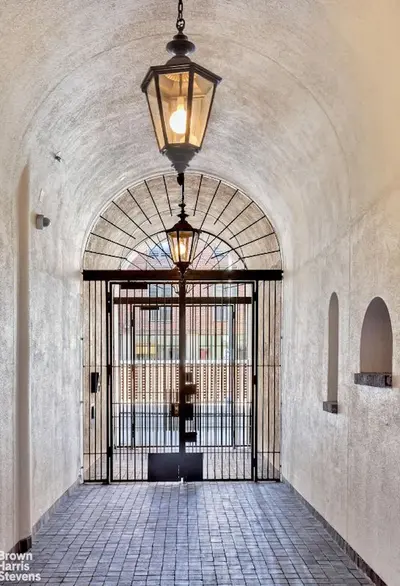
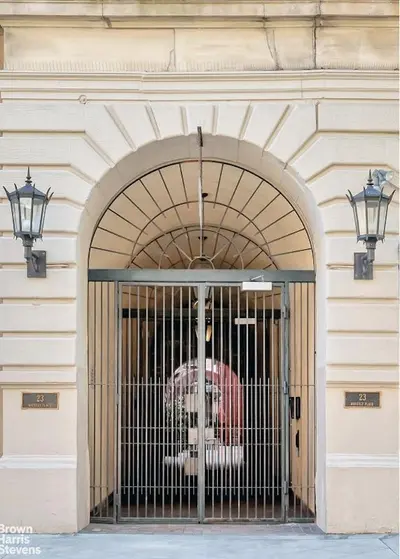
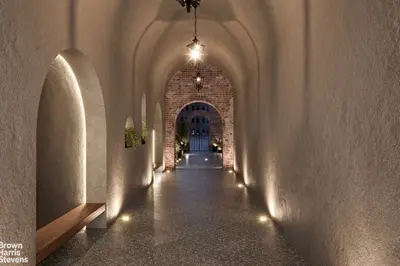
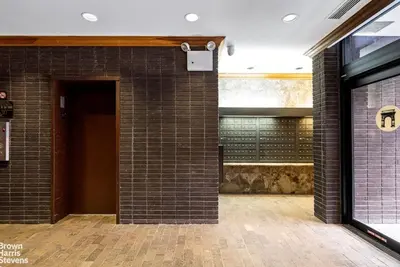
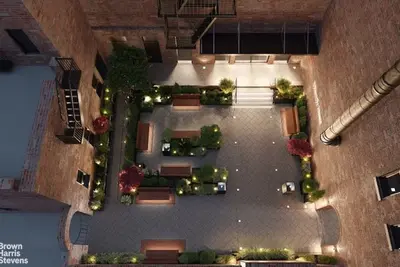
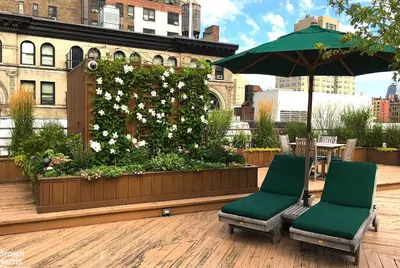
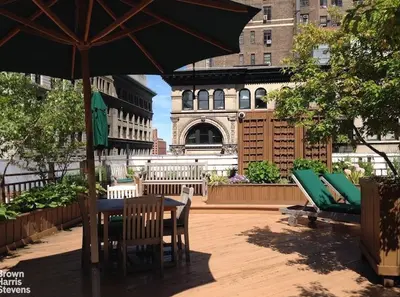
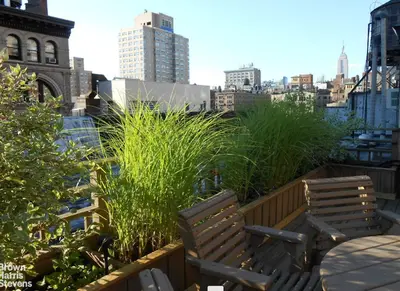
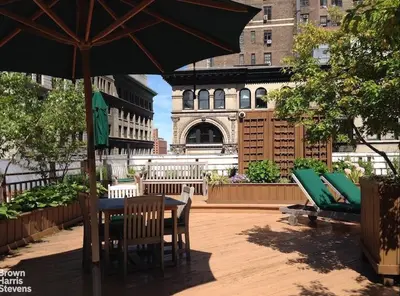
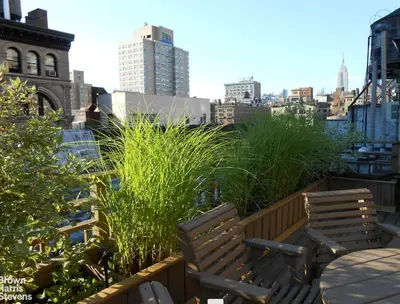
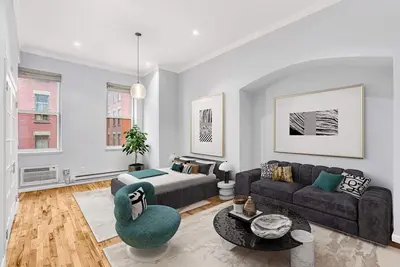
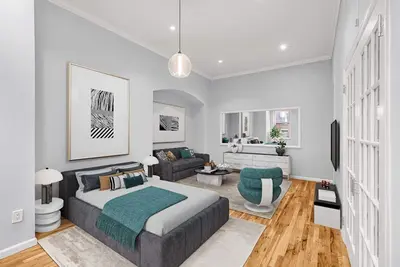
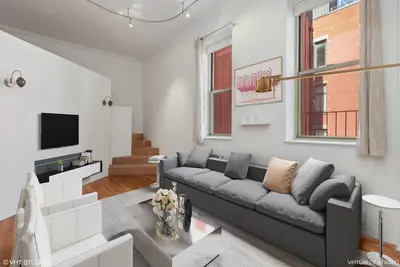
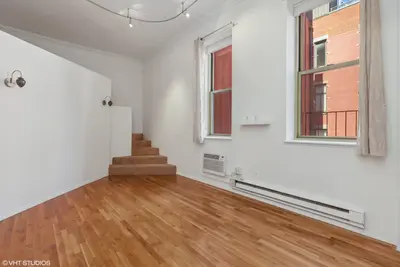
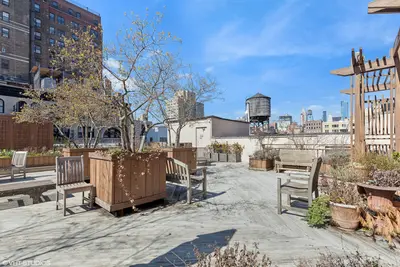
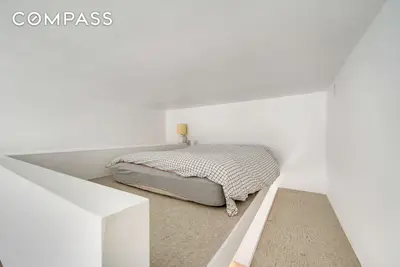
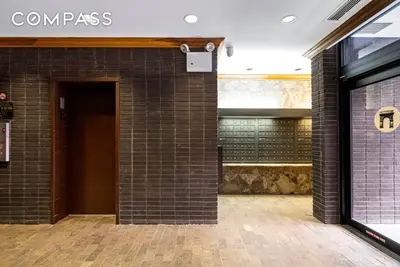
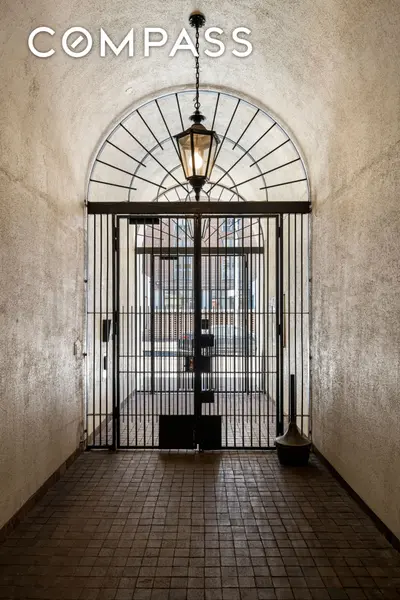
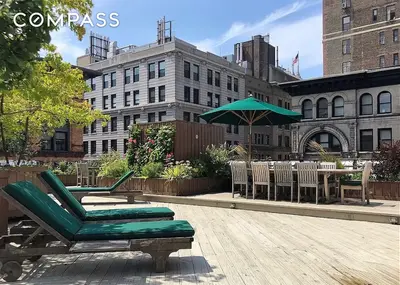
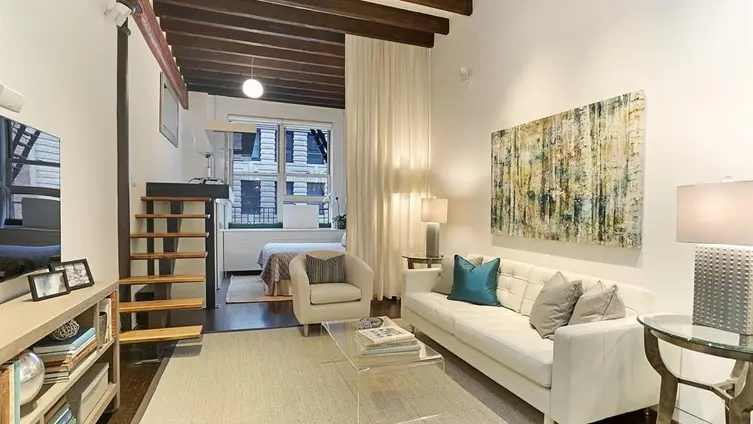
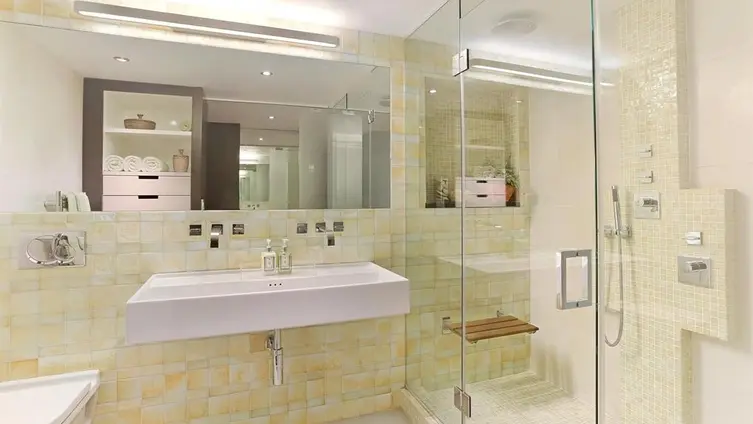
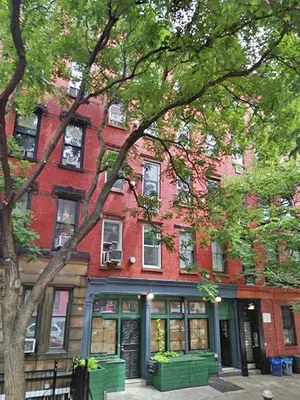
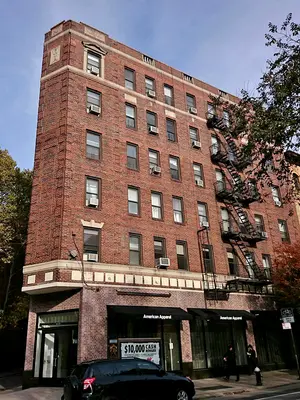
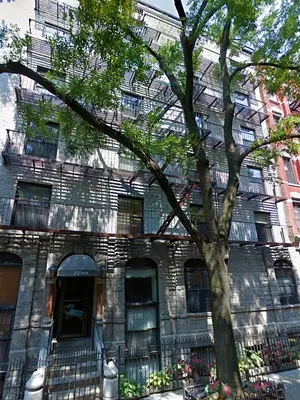
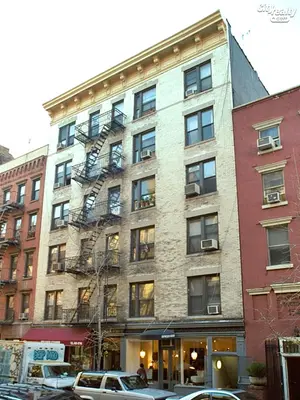
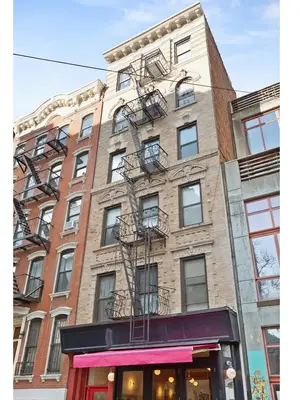
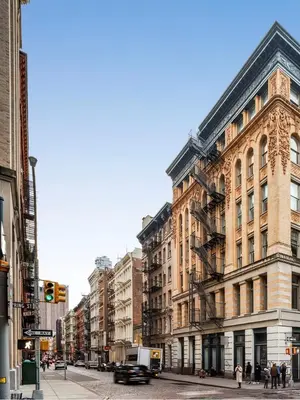
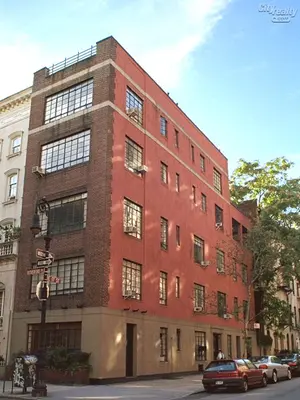
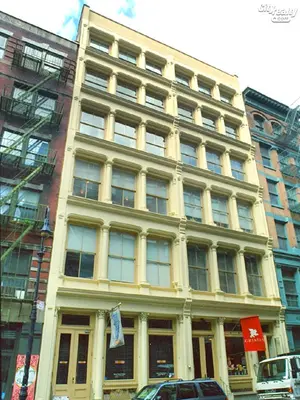
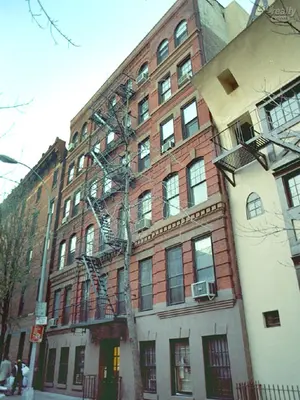
Waverly Mews is a six-story, 121-unit prewar cooperative in downtown Manhattan's Greenwich Village neighborhood built as a hat factory in 1891. Situated at 23 Waverly Place, between Mercer Street and Greene Street, the building is distinguished by its wrought-iron gate entrance and lovely communal courtyard. Amenities include two elevators, gated courtyard, laundry on every floor, a landscaped roof deck with benches, a hammock, and cabanas, and the services of a live-in superintendent.
No pied-a-terres, parents purchasing for children, or in-unit washer/dryers allowed. One dog is allowed, and dogs must interview with the board.
Learn more about off-market listings at Waverly Mews!

View school info, local attractions, transportation options & more.
Experience amazing 3D aerial maps and fly throughs.
For some co-ops, instead of price per square foot, we use an estimate of the number of rooms for each sold apartment to chart price changes over time. This is because many co-op listings do not include square footage information, and this makes it challenging to calculate accurate square-foot averages.
By displaying the price per estimated room count, we are able to provide a more reliable and consistent metric for comparing sales in the building. While we hope that this gives you a clearer sense of price trends in the building, all data should be independently verified. All data provided are only estimates and should not be used to make any purchase or sale decision.
|
Year
Avg Price / Ft2 (Est)
Median Price / Ft2 (Est)
Avg. Actual Price
Med. Actual Price
Transactions
2025
$1,216
$561,500
$1,216
$561,500
2
2024
$1,228
$651,000
$1,192
$650,000
5
2023
$1,100
$543,500
$1,100
$537,500
4
2022
$1,188
$703,400
$1,195
$572,000
5
2021
$1,117
$838,225
$1,117
$790,500
6
2020
$989
$516,417
$1,003
$545,000
6
2019
$1,380
$820,000
$1,380
$595,000
3
2018
$1,286
$690,800
$1,250
$709,000
5
2017
-
$667,500
-
$667,500
1
2016
$1,226
$647,571
$1,243
$649,000
7
2015
$742
$602,163
$742
$461,489
3
2014
$968
$514,000
$957
$525,000
5
|
Year
Avg Price / Ft2 (Est)
Median Price / Ft2 (Est)
Avg. Actual Price
Med. Actual Price
Transactions
2013
$937
$618,167
$962
$527,000
6
2012
$897
$508,700
$912
$478,500
10
2011
$864
$470,321
$880
$440,000
7
2010
$850
$439,000
$850
$430,000
3
2009
$755
$401,333
$830
$415,000
3
2008
$913
$579,800
$913
$515,000
5
2007
$967
$557,000
$967
$557,000
2
2006
$891
$597,000
$874
$492,250
6
2005
$892
$481,693
$900
$479,000
13
2004
$751
$386,417
$725
$395,500
12
2003
$569
$336,943
$575
$317,500
7
Please note that price/ft2 calculations is from only 60% of total transactions during the period
|
the following is a slider of images. For screen reader users, all slides are visible at all time so you may ignore control buttons.
Sign-up and we'll email you new listings in this building!
Whether you’re a buyer, investor, or simply curious, this report is your key to unlocking in-depth insights and analysis on .
Please confirm your details:
Broker & Buyer Comments