Skip to Content
18 East 63rd Street - Upper East Side
18 East 63rd Street
Co-Op in Park/Fifth Ave. to 79th St.
  • Apartments
  • Overview & Photos
  • Maps
  • Floorplans
  • Sales Data & Comps
Get alerts with new listings in this building!
18 East 63rd Street

18 East 63rd Street

Co-op located in Upper East Side, between Fifth Avenue & Madison Avenue  Map

  • Recent Sales (4)
  • All Units in Building (10)
Unit #
Beds
Baths
Size
Closing Price
Price / Ft2
Asking Price
Sold on
View Full Sales History

Overview of 18 East 63rd Street

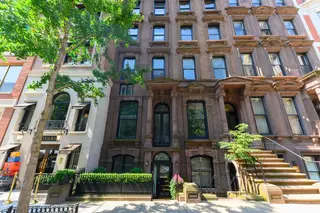
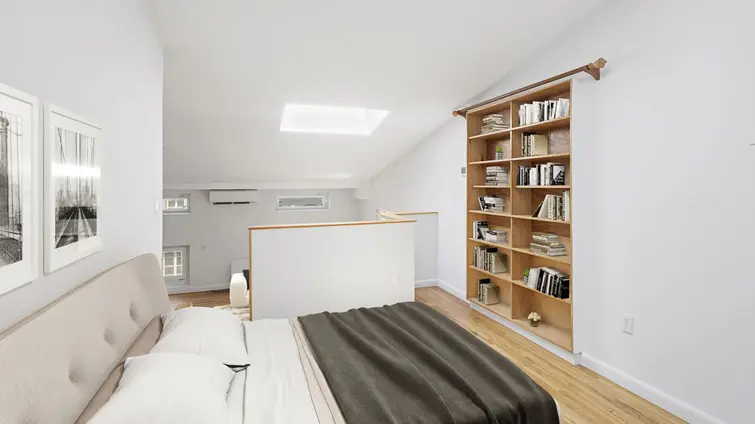
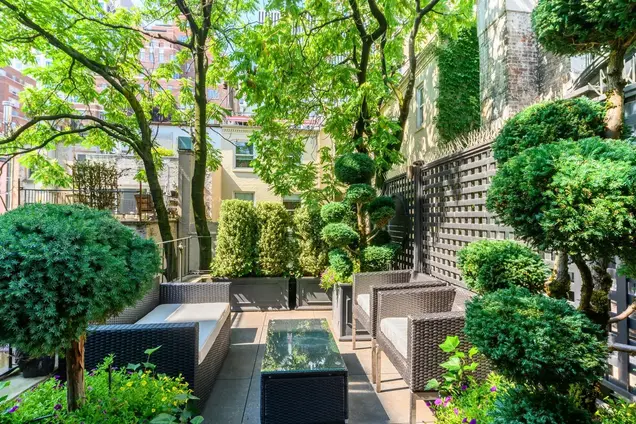
An elegant townhouse co-op, 18 East 63rd Street is nestled on a beautiful, quiet street between Fifth and Madison Avenues, is half a block from Central Park and in the midst of Manhattan's premier shopping, restaurants, and museums, including Bergdorf Goodman, Bloomingdale's, Chanel, Giorgio Armani, Apple, Daniel, Harry Cipriani, Nello, and Le Bilboquet. Public transportation options include the 4/5/6, N/Q/R/W, and F trains, as well as crosstown, northbound, and southbound cuses.

This elevator brownstone was originally built in 1876 and has recently undergone a complete renovation and restoration. In-unit washer/dryers are allowed, but dogs are not.

Year Built
1920
Apartments
10
Floors
4
Neighborhood
Min Down
20%
10Apartments
View All Past
Sales & Rentals
in Building

Schedule a Visit

Select when you would like to view apartments.
Sun
13
Mon
14
Tue
15
Wed
16
Thu
17
Fri
18
Sat
19
Sun
20
Mon
21
Tue
22

What Time?

9am-noon
Noon-3pm
3pm-6pm
Any time
You can also call us anytime at
☎️ (212) 755-5544

Amenities

  • Pre War
  • Elevator

Shh... Many units sell without being publicly listed.

Looking for something special? Select off-market options at 18 East 63rd Street may be available – connect with us for access.

{ "key" : "AIzaSyDquABdSLhathmwfnoTcYwA1BY6coZZyZk", "lat": 40.76611, "lng": -73.97022, "marker": { "icon": "https://img3.cityrealty.com/neo/i/w/amenities/base.png" } }

Nearby Subways

  1. N
  2. Q
  3. R
at 5th Ave and 60th 0.19 miles
  1. F
at Lexington Ave and 63rd 0.24 miles
  1. 4
  2. 5
  3. 6
at Lexington Ave and 60th 0.27 miles
  1. M
  2. E
at 5th Ave and 53rd 0.49 miles
Loading...

Sales History

Price/Room (Est)

Why are we displaying the estimated price per room?

For some co-ops, instead of price per square foot, we use an estimate of the number of rooms for each sold apartment to chart price changes over time. This is because many co-op listings do not include square footage information, and this makes it challenging to calculate accurate square-foot averages.

By displaying the price per estimated room count, we are able to provide a more reliable and consistent metric for comparing sales in the building. While we hope that this gives you a clearer sense of price trends in the building, all data should be independently verified. All data provided are only estimates and should not be used to make any purchase or sale decision.

Price/Ft2 (Est)
View Full Closing History
Created with Highstock 5.0.0SalesPrice per Room (Estimated)20032004200520062007200820092010201120122013201420152016201720182019202020212022202320242025012345$100,000$150,000$200,000$250,000$300,000$350,000
Year
Avg Price / Ft2 (Est) Median Price / Ft2 (Est) Avg. Actual Price Med. Actual Price
Transactions
2025
-
-
-
-
0
2024
-
$630,500
-
$630,500
2
2023
-
$1,305,000
-
$1,305,000
1
2022
-
$1,050,000
-
$1,050,000
1
2021
-
-
-
-
0
2020
-
-
-
-
0
2019
$787
$612,500
$787
$612,500
2
2018
-
$400,000
-
$400,000
1
2017
-
-
-
-
0
2016
-
$990,000
-
$990,000
2
2015
-
$1,200,000
-
$1,200,000
1
2014
-
-
-
-
0
Year
Avg Price / Ft2 (Est) Median Price / Ft2 (Est) Avg. Actual Price Med. Actual Price
Transactions
2013
$749
$599,000
$749
$599,000
1
2012
-
-
-
-
0
2011
$628
$489,000
$628
$495,000
3
2010
-
-
-
-
0
2009
-
-
-
-
0
2008
-
-
-
-
0
2007
-
$1,050,000
$1,050,000
1
2006
-
-
-
-
0
2005
-
$565,000
$565,000
2
2004
-
$620,000
$620,000
1
2003
-
$516,667
$485,000
3
Please note that price/ft2 calculations is from only 24% of total transactions during the period
Year
Avg Price / Room (Est) Avg. Actual Price Med. Actual Price
Transactions
2025
-
-
0
2024
$153,567
$630,500
2
2023
$261,000
$1,305,000
1
2022
$262,500
$1,050,000
1
2021
-
-
0
2020
-
-
0
2019
$204,167
$612,500
2
2018
$133,333
$400,000
1
2017
-
-
0
2016
$218,750
$990,000
2
2015
$300,000
$1,200,000
1
2014
-
-
0
Year
Avg Price / Room (Est) Avg. Actual Price Med. Actual Price
Transactions
2013
$149,750
$599,000
1
2012
-
-
0
2011
$149,194
$489,000
3
2010
-
-
0
2009
-
-
0
2008
-
-
0
2007
$210,000
$1,050,000
1
2006
-
-
0
2005
$141,250
$565,000
2
2004
$124,000
$620,000
1
2003
$130,528
$516,667
3

Sales History by Apartment Size

View Full Closing History
Show:

Pricing Comparison of Similar Buildings

View Detailed Comparison
Avg. Price / ft2

Similar Buildings

 
720 West End Avenue
between West 96th Street & West 95th Street
Riverside Dr./West End Ave.
Upper West Side condos from $995K near Riverside Park and the Hudson River. Occupancy 2025 | 30,000 SF of indoor/outdoor amenities.
Learn More

the following is a slider of images. For screen reader users, all slides are visible at all time so you may ignore control buttons.


Before you move on from this page

Sign-up and we'll email you new listings in this building!

or
Save Building with Email
By continuing you accept the Terms & Privacy Policy