Shh... Many units sell without being publicly listed.
Limited off-market opportunities might be available at 459 12th Street – ideal for those looking to explore listings not currently on the market. Contact us to learn more.
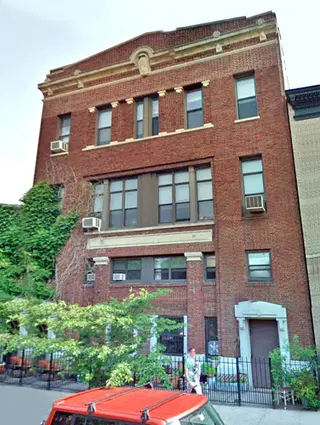
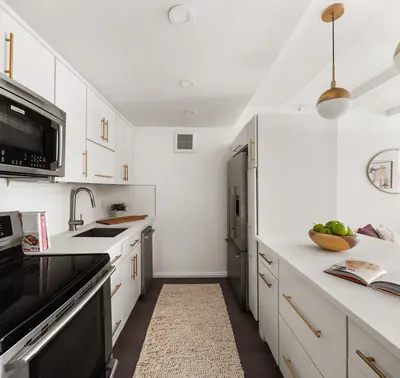
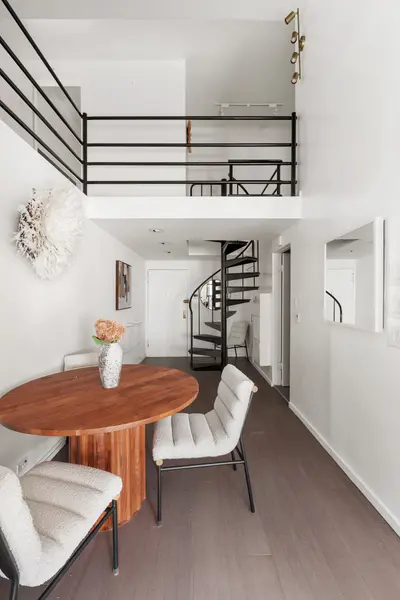
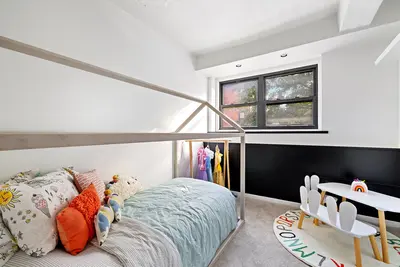
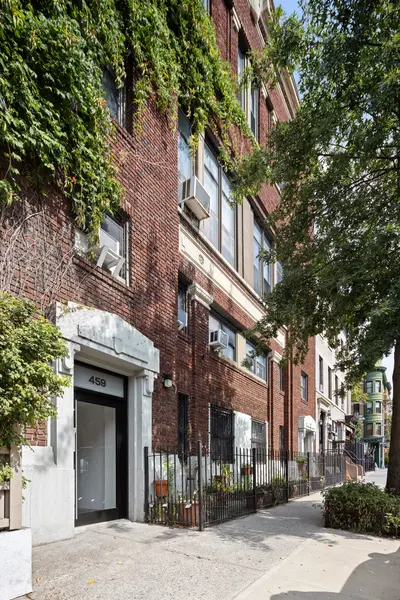
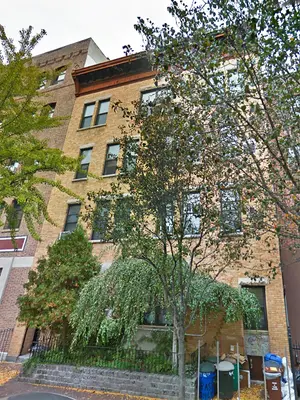
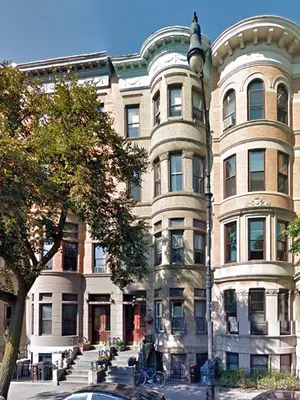
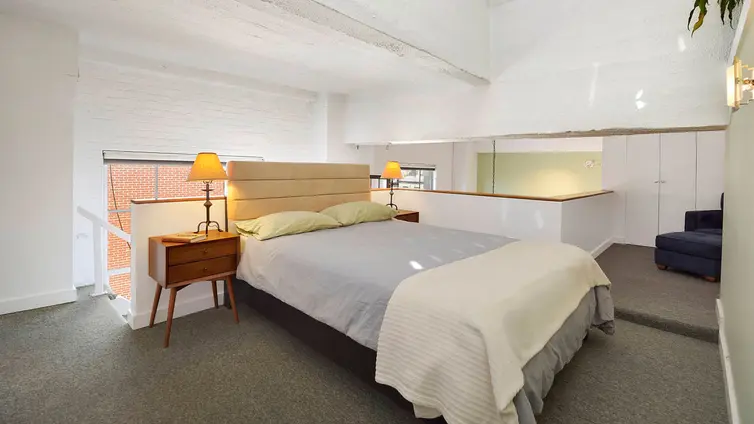
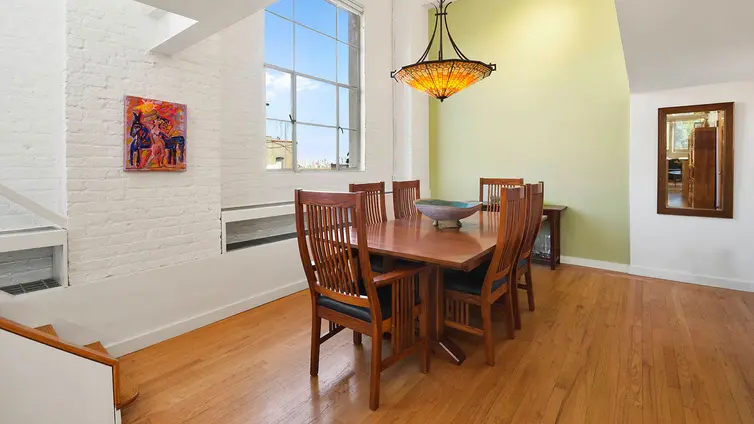
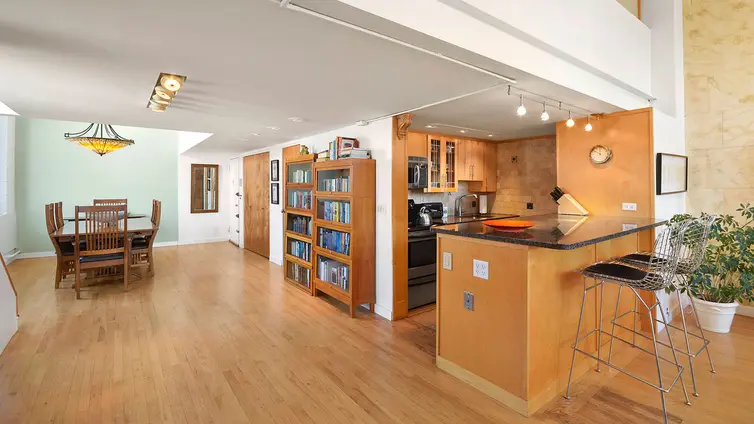
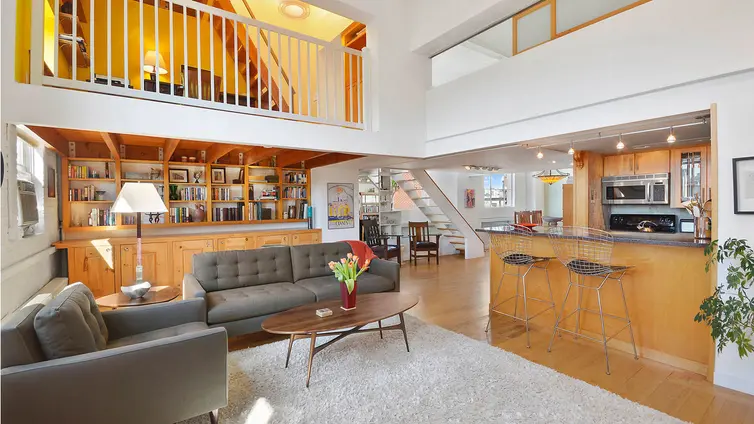
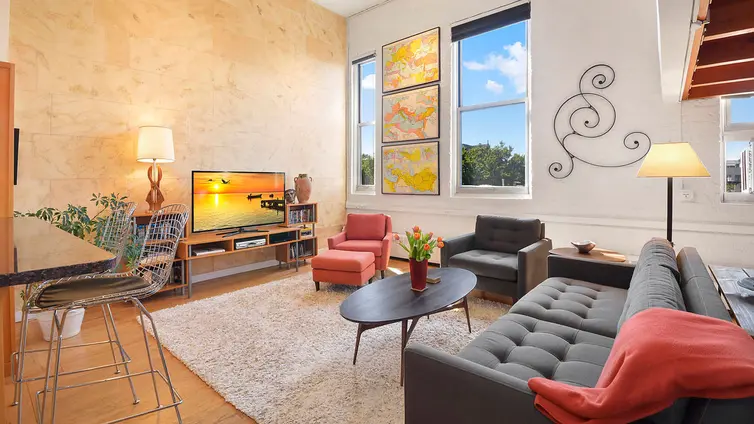
459 12th Street is a charming pre-war co-op in the heart of Park Slope. Built in 1940, this intimate four-story building features just 12 units, offering a peaceful retreat in one of Brooklyn’s most desirable neighborhoods.
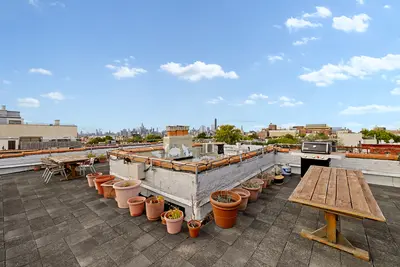
Residents enjoy basement storage and a common roof deck with breathtaking NYC skyline views. Situated on a picturesque, tree-lined street between 7th and 8th Avenues, the building is just steps from Prospect Park and surrounded by top restaurants, cafés, and boutiques. With the F/G subway lines nearby, commuting is effortless.
Limited off-market opportunities might be available at 459 12th Street – ideal for those looking to explore listings not currently on the market. Contact us to learn more.
View school info, local attractions, transportation options & more.
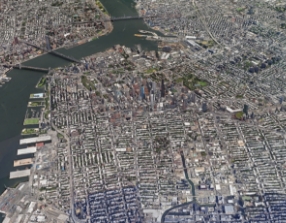
Experience amazing 3D aerial maps and fly throughs.
For some co-ops, instead of price per square foot, we use an estimate of the number of rooms for each sold apartment to chart price changes over time. This is because many co-op listings do not include square footage information, and this makes it challenging to calculate accurate square-foot averages.
By displaying the price per estimated room count, we are able to provide a more reliable and consistent metric for comparing sales in the building. While we hope that this gives you a clearer sense of price trends in the building, all data should be independently verified. All data provided are only estimates and should not be used to make any purchase or sale decision.
|
Year
Avg Price / Ft2 (Est)
Median Price / Ft2 (Est)
Avg. Actual Price
Med. Actual Price
Transactions
2025
-
-
-
-
0
2024
-
-
-
-
0
2023
-
-
-
-
0
2022
-
-
-
-
0
2021
-
-
-
-
0
2020
$836
$1,130,000
$836
$1,130,000
2
2019
-
-
-
-
0
2018
$933
$1,400,000
$933
$1,400,000
1
2017
-
-
-
-
0
2016
-
-
-
-
0
2015
-
$1,137,500
-
$1,137,500
2
2014
$804
$1,206,000
$804
$1,206,000
1
|
Year
Avg Price / Ft2 (Est)
Median Price / Ft2 (Est)
Avg. Actual Price
Med. Actual Price
Transactions
2013
$596
$715,000
$596
$715,000
1
2012
$543
$815,000
$543
$815,000
1
2011
-
-
-
-
0
2010
$524
$720,000
$524
$720,000
1
2009
-
-
-
-
0
2008
-
-
-
-
0
2007
$625
$895,000
$625
$895,000
2
2006
$493
$740,000
$493
$740,000
1
2005
-
-
-
-
0
2004
$439
$636,000
$439
$652,000
4
2003
$377
$565,000
$377
$565,000
1
Please note that price/ft2 calculations is from only 65% of total transactions during the period
|
the following is a slider of images. For screen reader users, all slides are visible at all time so you may ignore control buttons.
Sign-up and we'll email you new listings in this building!
Whether you’re a buyer, investor, or simply curious, this report is your key to unlocking in-depth insights and analysis on .
Please confirm your details: