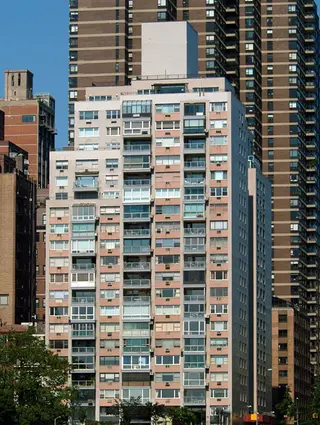
35 Sutton Place: Sales Summary
between East 58th Street & East 59th Street Building Profile
All Sales
$755
Avg. Price / ft2
Past 12 months, based on 10 sales
$1,208,500
Avg. Price -
Past 12 months, based on 10 sales
$764
Median Price / ft2
Past 12 months, based on 10 sales
$1,132,500
Median Price
Past 12 months, based on 10 sales
Year
Avg Price / Ft2
Median Price / Ft2
Avg. Actual Price
Med. Actual Price
Transactions
2025
$750
$1,600,000
$750
$1,600,000
2
2024
$755
$1,118,000
$764
$1,147,500
10
2023
$711
$1,187,500
$713
$1,125,000
6
2022
$721
$1,805,833
$721
$1,805,000
6
2021
$742
$1,362,143
$722
$1,360,000
7
2020
$846
$1,418,375
$740
$1,261,000
8
2019
$1,037
$1,400,000
$1,141
$1,300,000
6
2018
$844
$1,172,500
$844
$1,172,500
2
2017
$907
$1,570,714
$927
$1,715,000
7
2016
$897
$1,871,500
$897
$1,770,500
4
2015
-
-
-
-
0
2014
$1,068
$1,547,625
$1,152
$1,350,000
8
2013
$735
$1,385,000
$735
$1,385,000
2
Year
Avg Price / Ft2
Median Price / Ft2
Avg. Actual Price
Med. Actual Price
Transactions
2012
$727
$1,209,950
$682
$1,225,000
6
2011
$710
$1,172,000
$710
$1,172,000
1
2010
$833
$1,579,714
$782
$1,350,000
7
2009
$770
$1,386,000
$770
$1,386,000
1
2008
$1,016
$1,983,333
$1,016
$2,250,000
3
2007
$907
$1,540,000
$800
$1,375,000
5
2006
$1,073
$2,149,722
$1,073
$1,895,000
9
2005
-
$1,490,000
$1,490,000
1
2004
$765
$1,254,850
$762
$1,225,000
10
2003
$541
$1,005,667
$541
$887,500
6
The Breakdown of All Sales by Apartment Size

 6sqft delivers the latest on real estate, architecture, and design, straight from New York City.
