4 Sutton Place, 465 East 57th Street - Beekman/Sutton Place
- Apartments
- Overview & Photos
- Maps
- Floorplans
- Sales Data & Comps
- Similar Buildings
- All Units
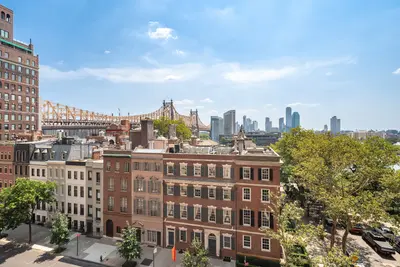
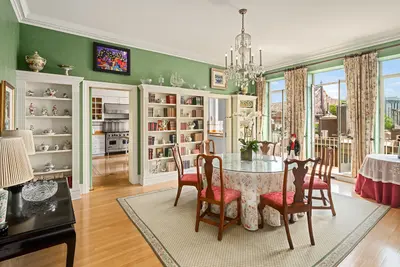
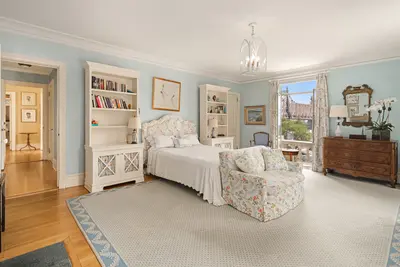
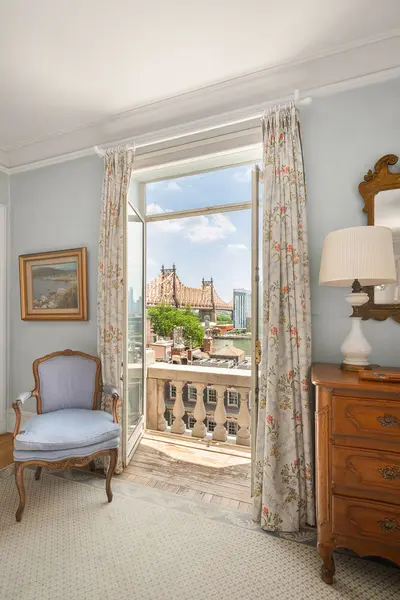
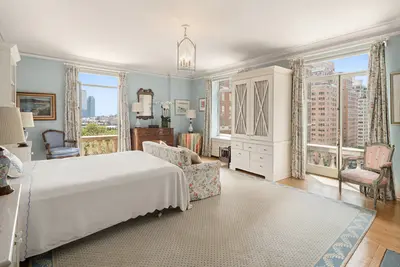

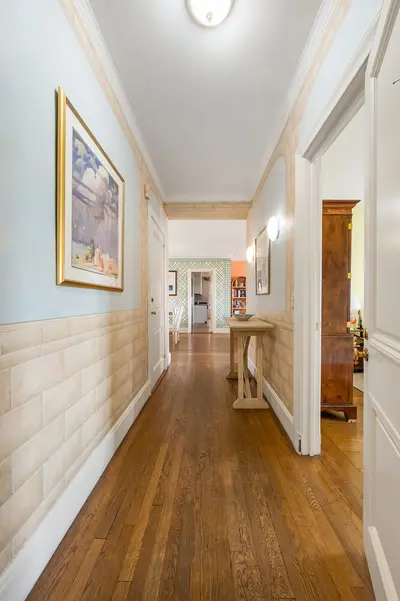
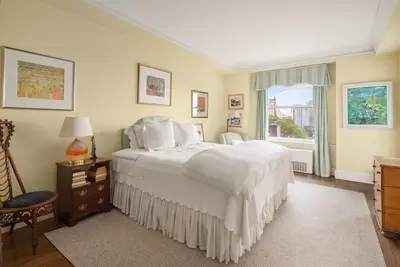
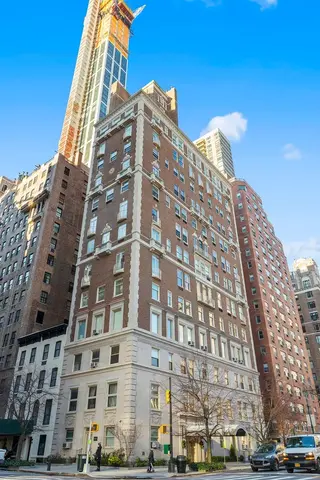
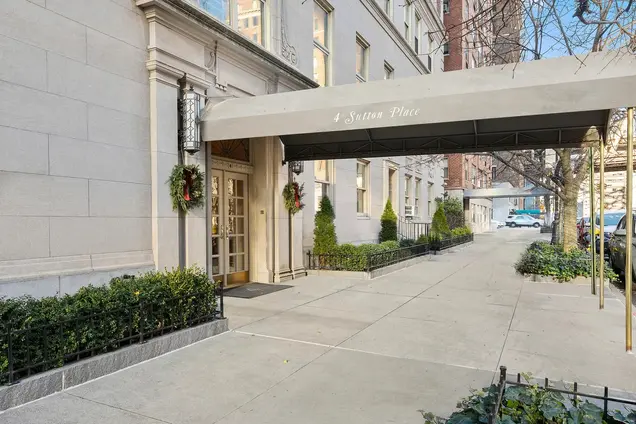
Four Sutton Place comes from the drafting table of Rosario Candela, the architect behind some of New York’s finest pre-war apartment buildings. The distinctive window pattern responds to the unique layouts of spacious duplex units within. The slender high-rise stands in the center of the rarified Sutton Place neighborhood and faces the nearby East River and the Queensboro Bridge. The articulated pinnacle makes an elegant skyline statement and hosts a compact yet luxe roof deck.
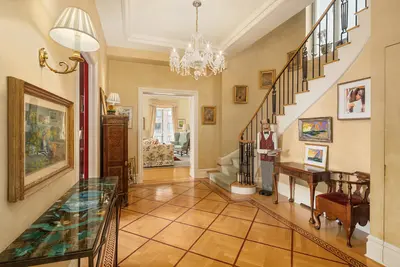
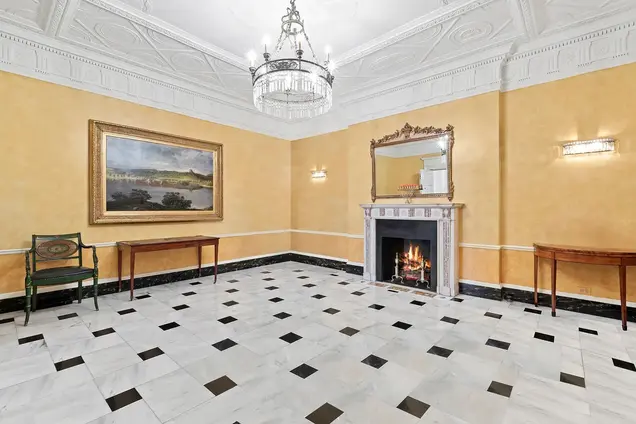
Residents of Four Sutton Place are greeted by an elegant lobby with a full-time doorman. The building is located at 465 East 57th Street in an exclusive enclave by the East River. 50% financing is permitted.

View school info, local attractions, transportation options & more.
Experience amazing 3D aerial maps and fly throughs.
For some co-ops, instead of price per square foot, we use an estimate of the number of rooms for each sold apartment to chart price changes over time. This is because many co-op listings do not include square footage information, and this makes it challenging to calculate accurate square-foot averages.
By displaying the price per estimated room count, we are able to provide a more reliable and consistent metric for comparing sales in the building. While we hope that this gives you a clearer sense of price trends in the building, all data should be independently verified. All data provided are only estimates and should not be used to make any purchase or sale decision.