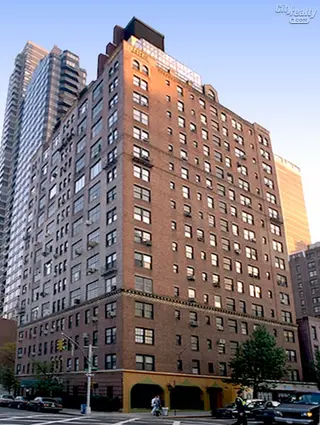
400 East 59th Street: Sales Summary
at The Southeast corner of First Avenue Building Profile
All Sales
$859
Avg. Price / ft2
Past 12 months, based on 8 sales
$627,500
Avg. Price -
Past 12 months, based on 8 sales
$859
Median Price / ft2
Past 12 months, based on 8 sales
$567,500
Median Price
Past 12 months, based on 8 sales
Year
Avg Price / Ft2
Median Price / Ft2
Avg. Actual Price
Med. Actual Price
Transactions
2025
$859
$488,750
$859
$497,500
4
2024
-
$955,833
-
$967,500
6
2023
-
-
-
-
0
2022
$871
$899,819
$871
$784,094
5
2021
$680
$819,500
$669
$787,500
10
2020
$1,094
$1,820,000
$1,094
$1,025,000
3
2019
$775
$549,650
$775
$532,500
6
2018
$821
$872,167
$821
$652,000
6
2017
$788
$753,613
$785
$673,500
8
2016
$905
$765,578
$905
$660,000
7
2015
$827
$747,581
$827
$585,325
8
2014
$743
$818,000
$688
$775,000
5
2013
$719
$687,999
$727
$587,000
14
Year
Avg Price / Ft2
Median Price / Ft2
Avg. Actual Price
Med. Actual Price
Transactions
2012
$841
$717,600
$841
$650,000
5
2011
$1,015
$2,415,000
$1,015
$2,415,000
2
2010
-
$757,000
$757,000
1
2009
$798
$1,132,500
$798
$1,132,500
2
2008
$709
$792,813
$727
$562,500
8
2007
$839
$989,659
$823
$855,000
14
2006
$776
$626,416
$773
$593,750
10
2005
$511
$521,214
$628
$540,000
7
2004
$560
$525,786
$550
$485,000
14
2003
$546
$401,489
$535
$410,000
8
The Breakdown of All Sales by Apartment Size
Studios
$859
Avg. Price / ft2 -
Past 12 months, based on 2 sales
$402,500
Avg. Price -
Past 12 months, based on 2 sales
$859
Median Price / ft2 -
Past 12 months, based on 2 sales
$402,500
Median Price -
Past 12 months, based on 2 sales
Show More
two Bedrooms
$0
Avg. Price / ft2 -
Past 12 months, based on 1 sale
$1,250,000
Avg. Price -
Past 12 months, based on 1 sale
$0
Median Price / ft2 -
Past 12 months, based on 1 sale
$1,250,000
Median Price -
Past 12 months, based on 1 sale
Show More
four Bedrooms
No sales in the past 12 months
No sales in the past 12 months
No sales in the past 12 months
No sales in the past 12 months
Show More
one Bedroom
$0
Avg. Price / ft2 -
Past 12 months, based on 5 sales
$593,000
Avg. Price -
Past 12 months, based on 5 sales
$0
Median Price / ft2 -
Past 12 months, based on 5 sales
$580,000
Median Price -
Past 12 months, based on 5 sales
Show More
three Bedrooms
No sales in the past 12 months
No sales in the past 12 months
No sales in the past 12 months
No sales in the past 12 months
Show More
five Bedrooms
No sales in the past 12 months
No sales in the past 12 months
No sales in the past 12 months
No sales in the past 12 months
Show More