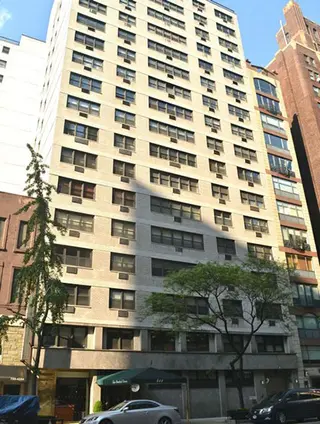
411 East 57th Street - Beekman/Sutton Place
- Apartments
- Overview & Photos
- Maps
- Floorplans
- Sales Data & Comps
- Similar Buildings
- All Units
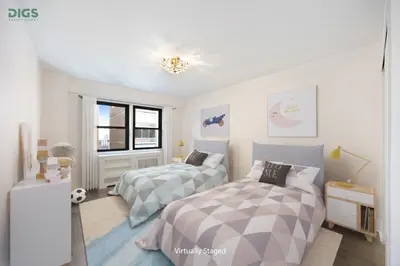
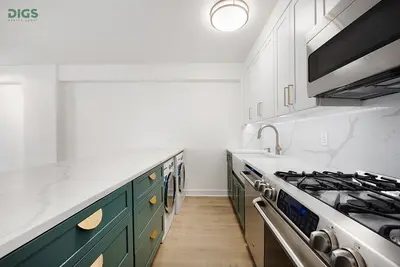
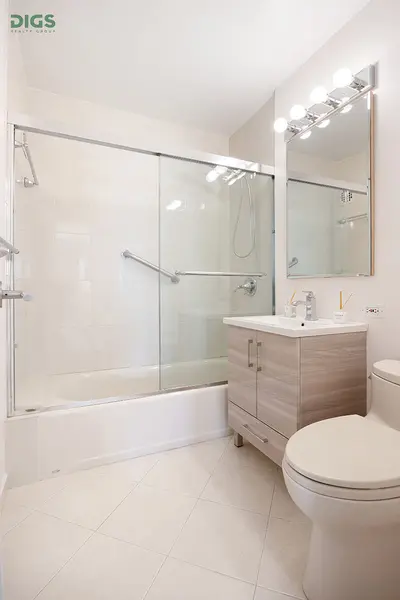
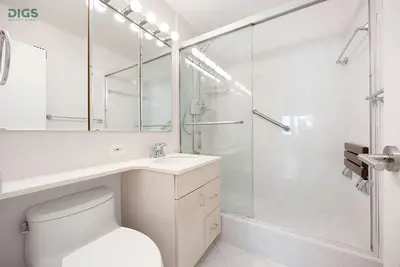
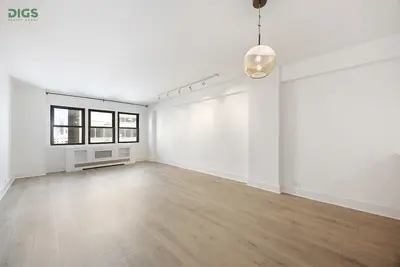
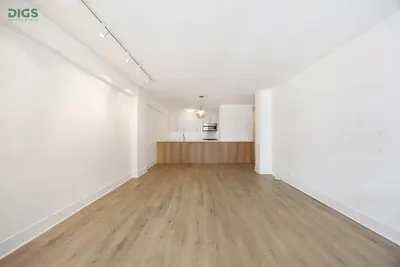
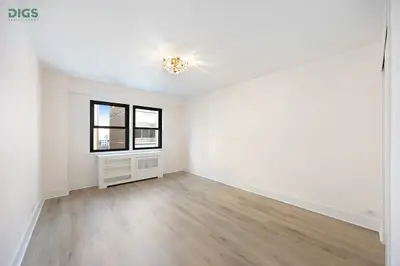
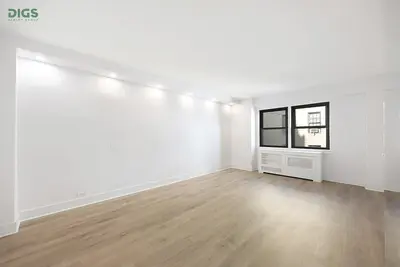
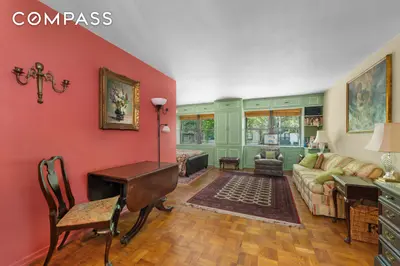
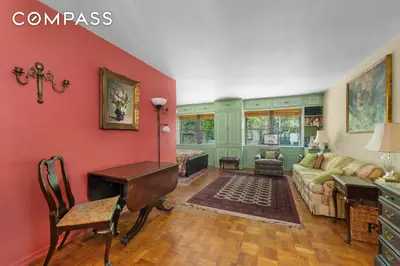


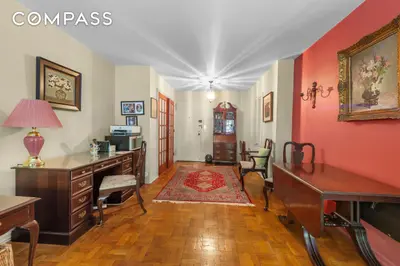


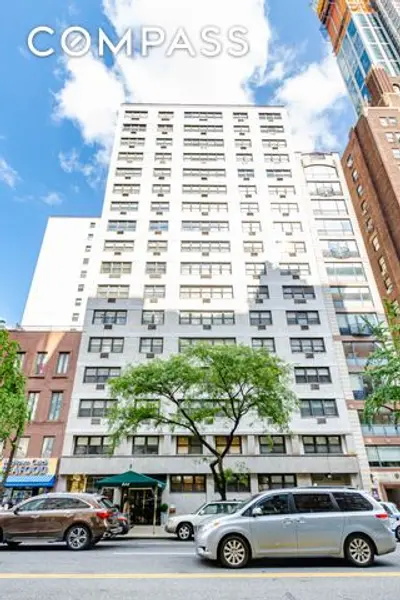

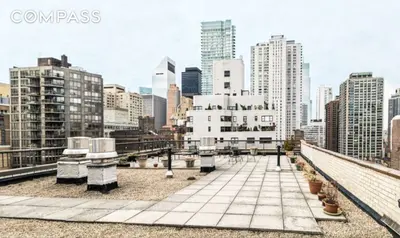
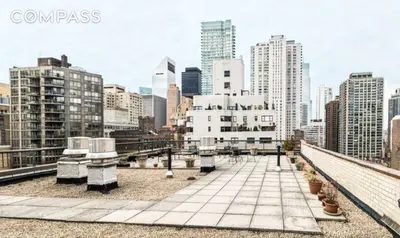
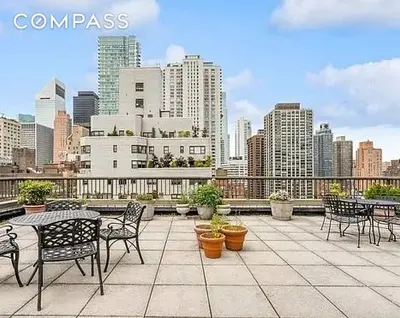

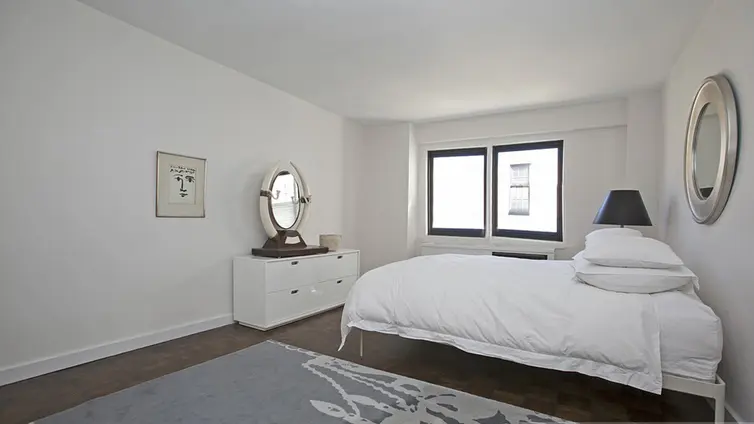
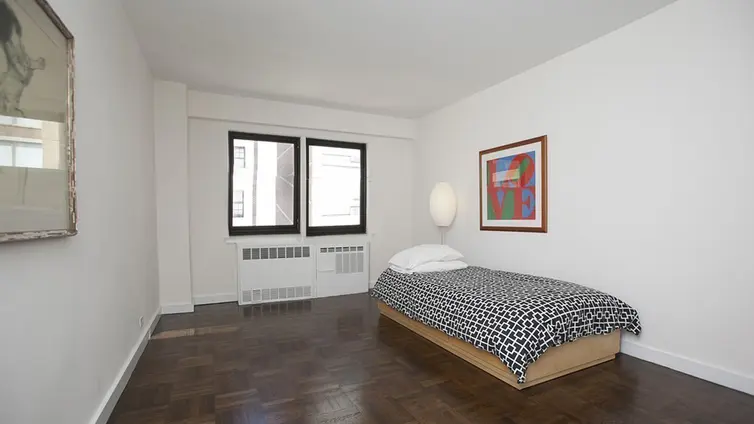
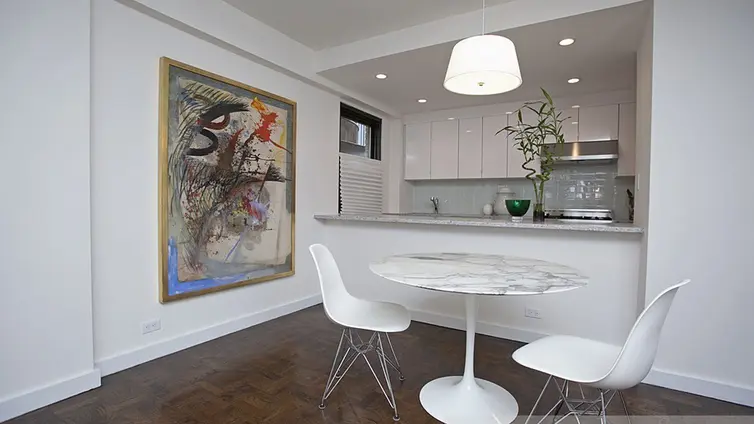
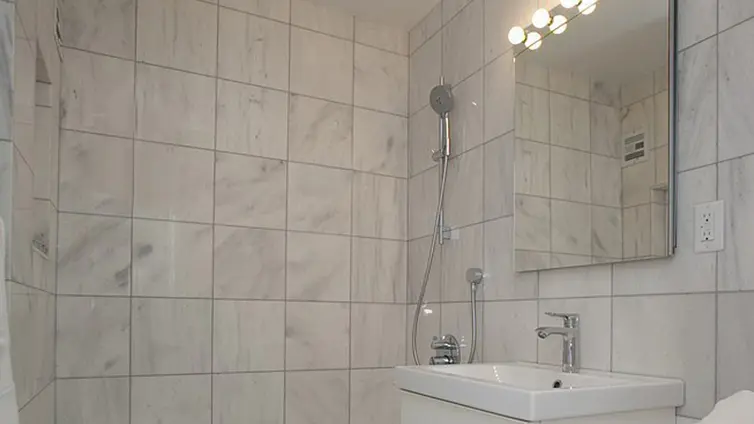
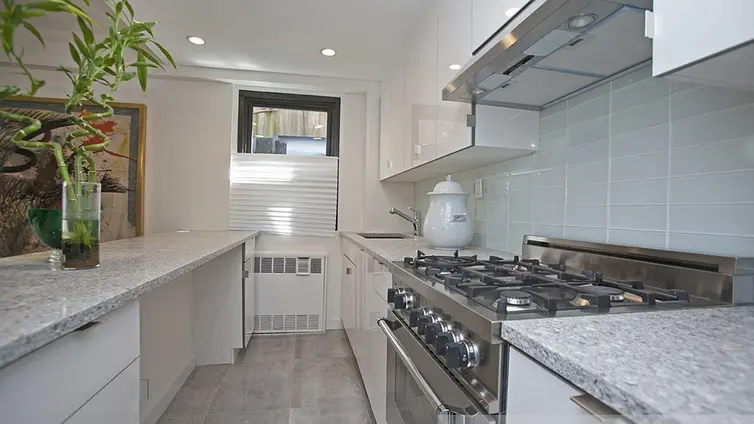
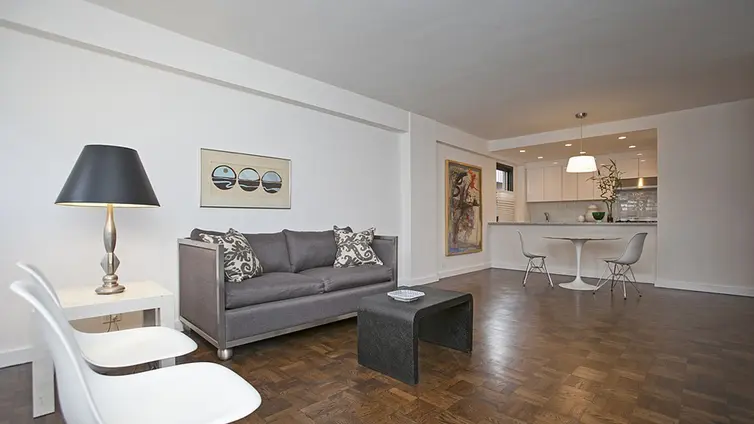
411 East 57th Street is a full-service cooperative built in 1959 and featuring new hallways and elevators. Amenities and staff include a live-in superintendent, package room, laundry room, bike room, and roof deck. Individual storage units are available for a small monthly fee. The building is one block from Sutton Place Park and close to Whole Foods, fine and casual dining, boutiques, and the 4/5/6/N/R/E/M trains. Pied-a-terres, guarantors, and gifting are permitted.

View school info, local attractions, transportation options & more.
Experience amazing 3D aerial maps and fly throughs.
For some co-ops, instead of price per square foot, we use an estimate of the number of rooms for each sold apartment to chart price changes over time. This is because many co-op listings do not include square footage information, and this makes it challenging to calculate accurate square-foot averages.
By displaying the price per estimated room count, we are able to provide a more reliable and consistent metric for comparing sales in the building. While we hope that this gives you a clearer sense of price trends in the building, all data should be independently verified. All data provided are only estimates and should not be used to make any purchase or sale decision.