444 East 52nd Street - Beekman/Sutton Place
- Apartments
- Overview & Photos
- Maps
- Floorplans
- Sales Data & Comps
- Similar Buildings
- All Units

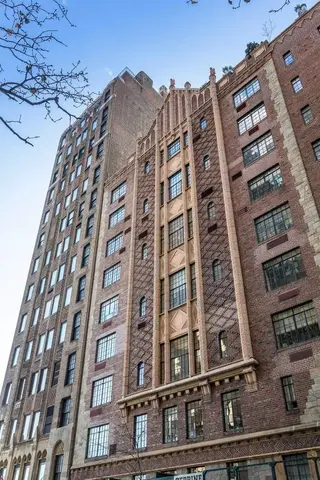
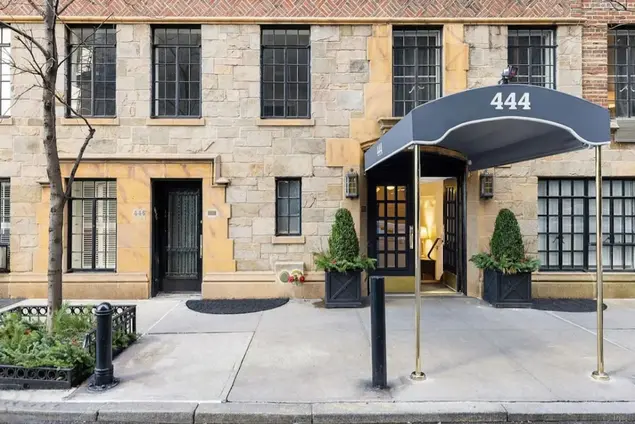
444 East 52nd Street, completed in 1929, is an elegant 11-story cooperative building situated on a quiet cul-de-sac between Sutton Place and Beekman Place. The building's distinctive architecture features an impressive arched roofline adorned with pelican finials, red brick façade with rusticated base, quoins, and consistent multi-paned fenestration.
The full-service building contains 52 apartments and provides white-glove amenities including a 24-hour doorman, elevator operator, and live-in superintendent. Additional services include door-to-door mail and newspaper delivery, laundry facilities, bike room, and storage. The building permits pets, pied-a-terres, and parents purchasing for children, with a maximum financing allowance of 75%.
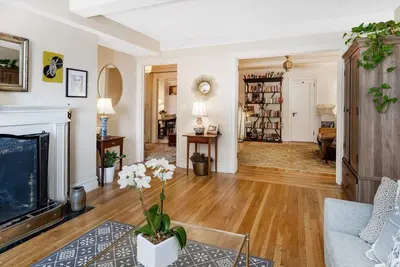
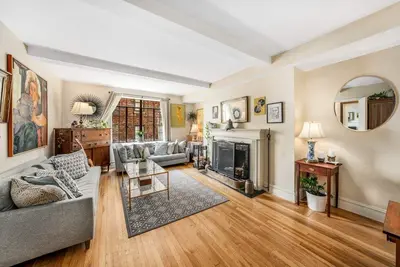
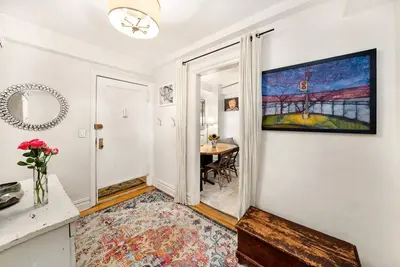
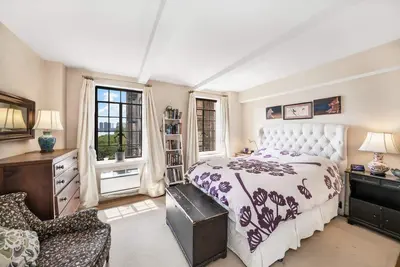
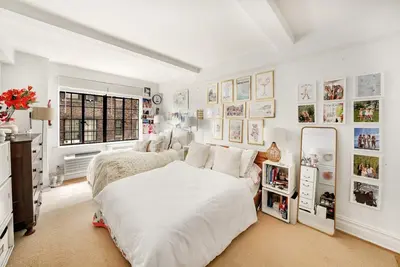
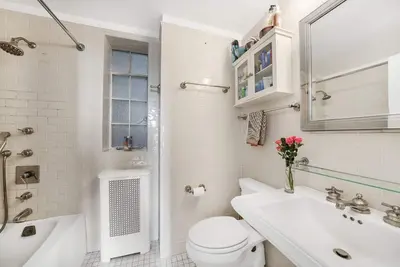
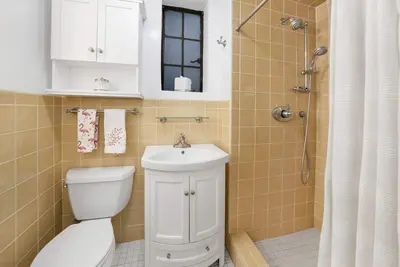
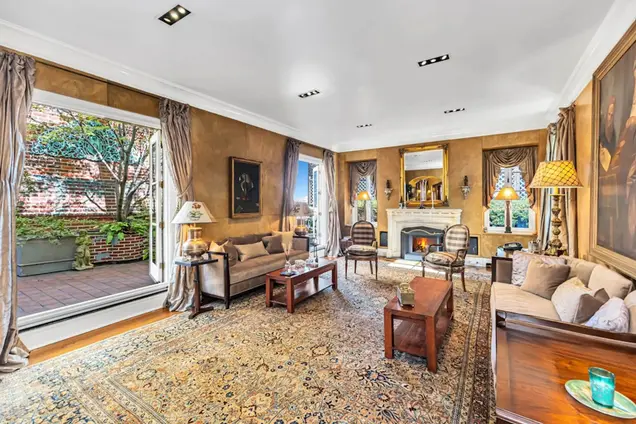
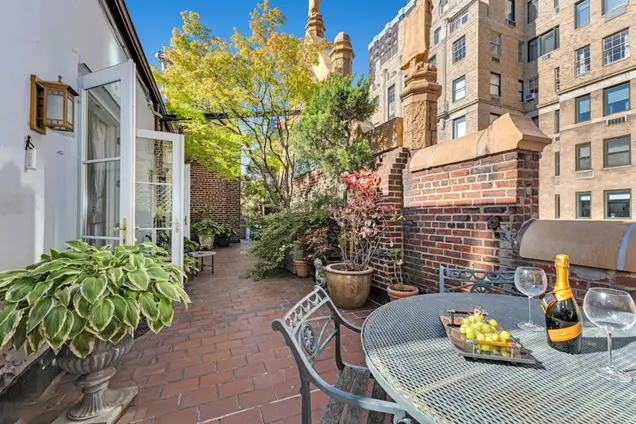
Apartments feature classic pre-war details throughout, with some units offering wood-burning fireplaces and East River views. The building is particularly notable for its penthouses, including one with a spectacular wraparound terrace complete with mature landscaping and irrigation systems. The building has a rich history, having once been home to Dorothy Parker, who found inspiration in its tranquil riverside location.
The location offers convenient access to numerous amenities, including gourmet grocery stores, the United Nations, and various dining establishments. While not immediately proximate to subway lines, the area is well-served by several crosstown bus routes including the M57, M31, and M50.
The building maintains its historic character while providing modern amenities, creating an exclusive retreat that blends classic elegance with contemporary comfort. Its position across from the prestigious River House adds to its appeal, though unlike its neighbor, 444 East 52nd Street does not have direct river views from most apartments due to an intervening building.


View school info, local attractions, transportation options & more.
Experience amazing 3D aerial maps and fly throughs.
For some co-ops, instead of price per square foot, we use an estimate of the number of rooms for each sold apartment to chart price changes over time. This is because many co-op listings do not include square footage information, and this makes it challenging to calculate accurate square-foot averages.
By displaying the price per estimated room count, we are able to provide a more reliable and consistent metric for comparing sales in the building. While we hope that this gives you a clearer sense of price trends in the building, all data should be independently verified. All data provided are only estimates and should not be used to make any purchase or sale decision.