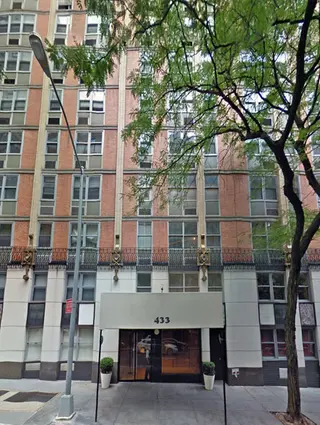
The George, 433 East 56th Street - Beekman/Sutton Place
- Apartments
- Overview & Photos
- Maps
- Floorplans
- Sales Data & Comps
- Similar Buildings
- All Units
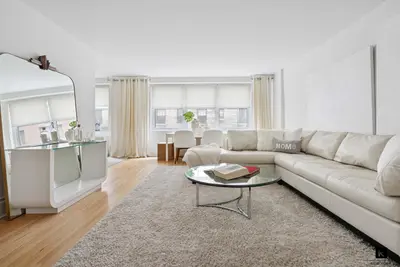
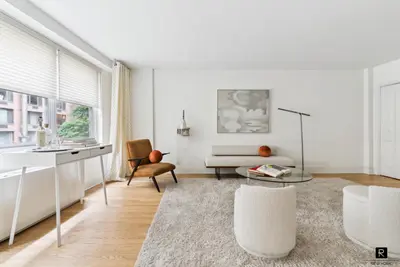
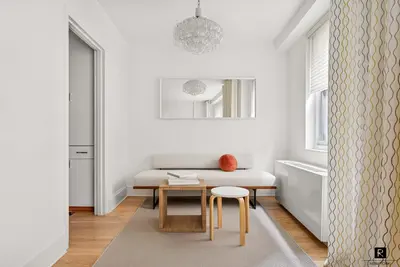
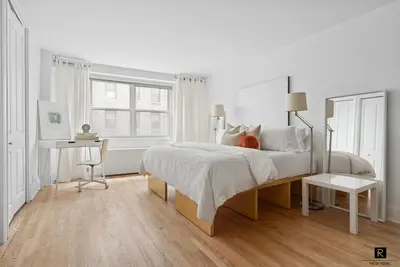
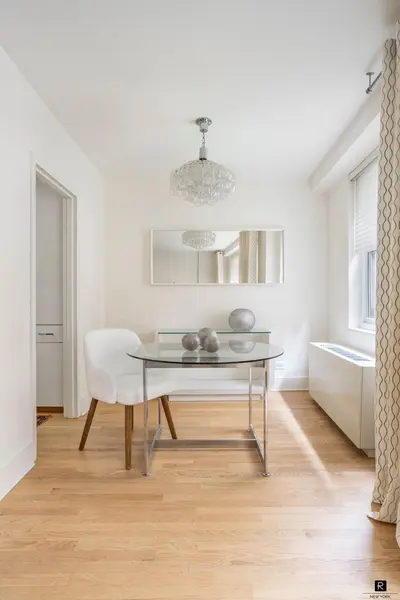
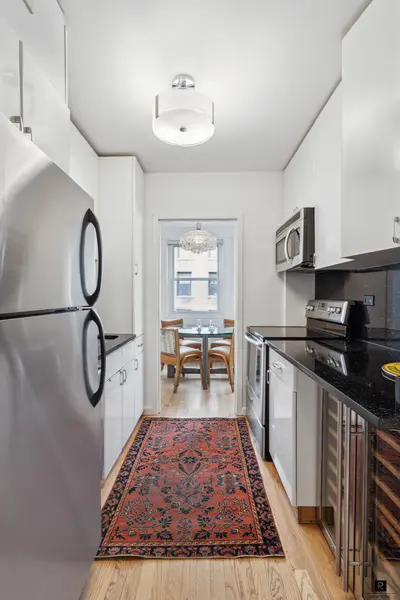
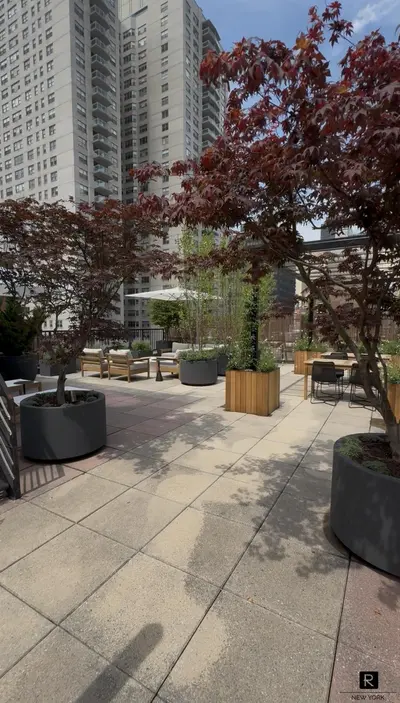
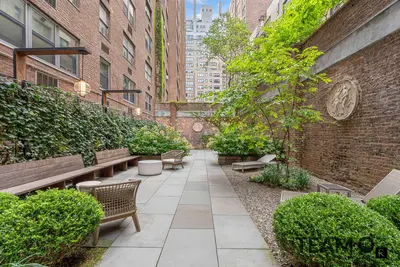
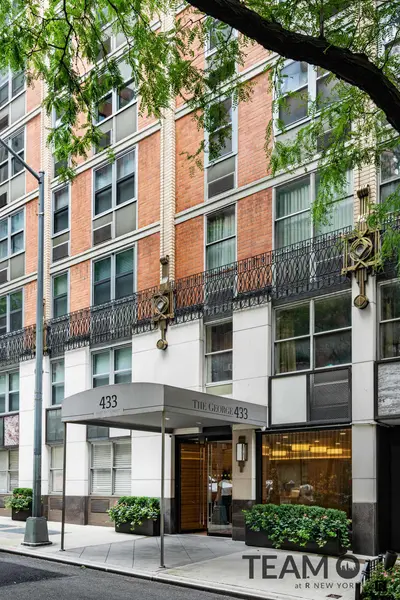
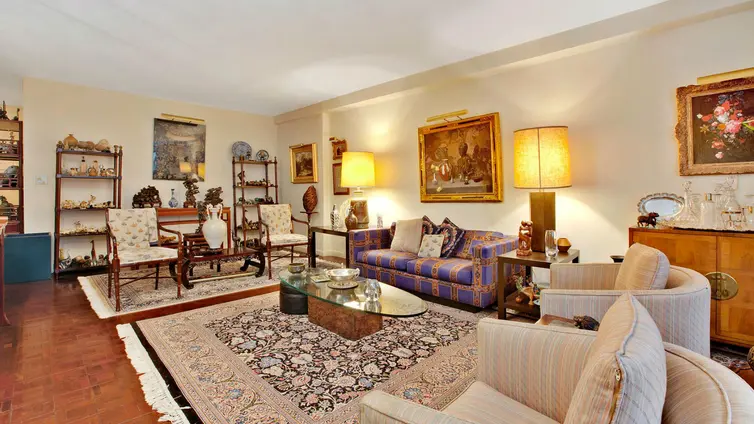
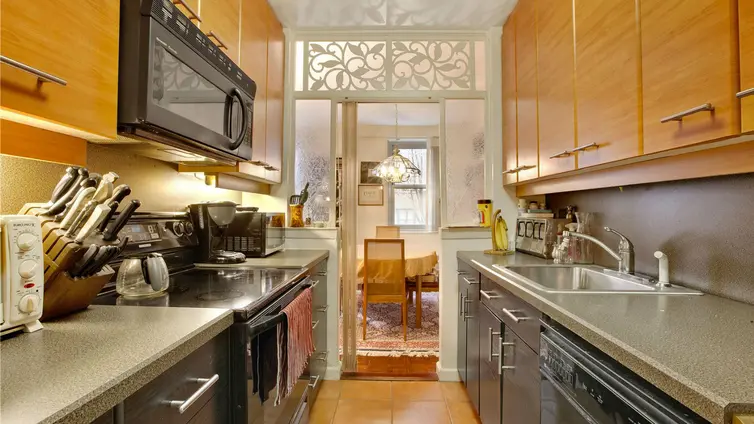
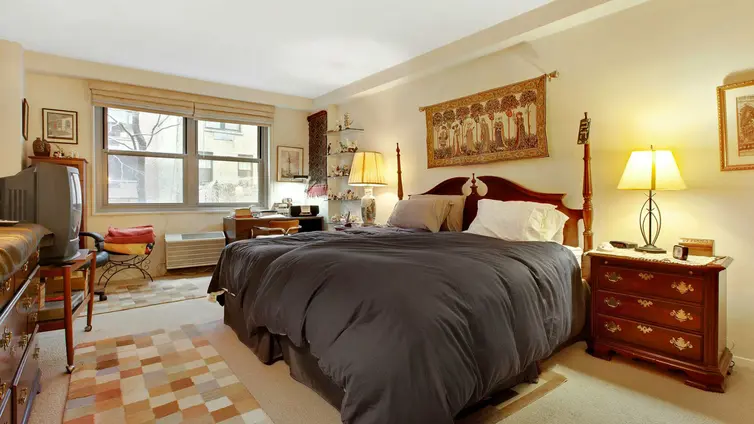
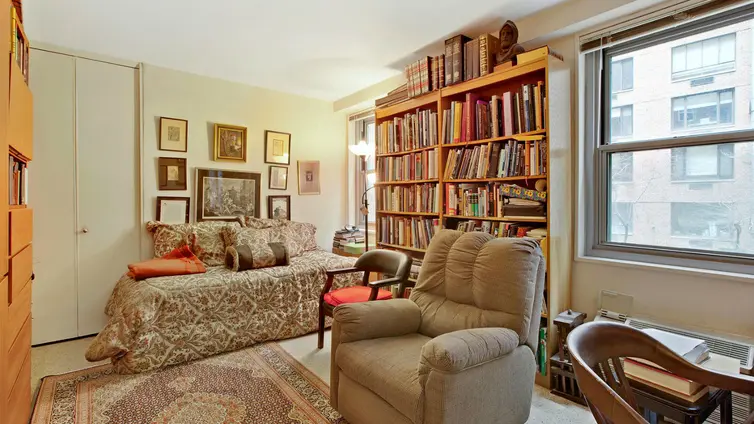
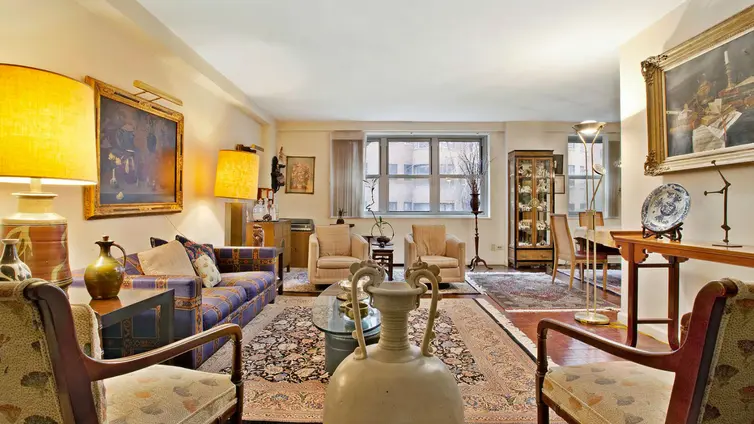
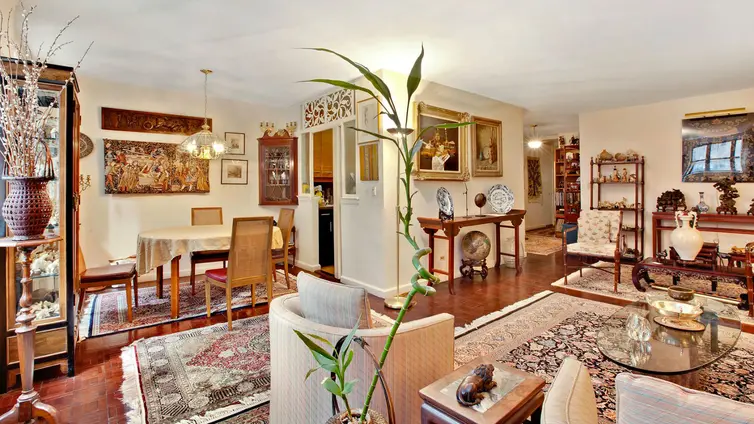
The George is a postwar boutique cooperative located at 433 East 56th Street near the East River running park, Midtown shopping, Whole Foods, the Bridgemarket Trader Joe's, and multiple subway and bus lines. Residential amenities include a large backyard garden, a roof deck, a fitness room, private storage, and bike storage.
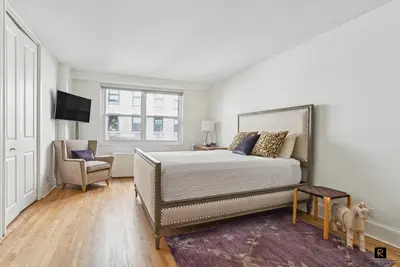
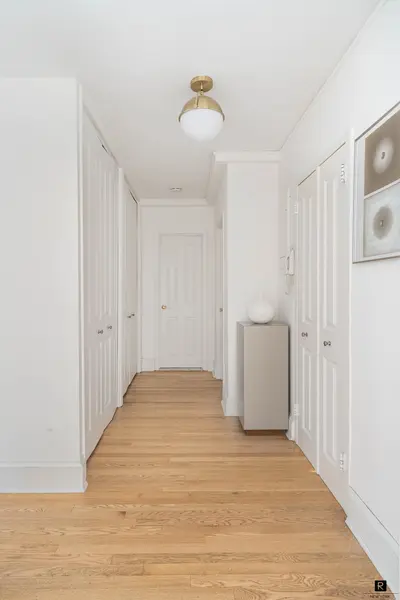
The George permits 75% financing and in-unit washer/dryers. Sublets and pied-a-terres are allowed with board approval.

View school info, local attractions, transportation options & more.
Experience amazing 3D aerial maps and fly throughs.
For some co-ops, instead of price per square foot, we use an estimate of the number of rooms for each sold apartment to chart price changes over time. This is because many co-op listings do not include square footage information, and this makes it challenging to calculate accurate square-foot averages.
By displaying the price per estimated room count, we are able to provide a more reliable and consistent metric for comparing sales in the building. While we hope that this gives you a clearer sense of price trends in the building, all data should be independently verified. All data provided are only estimates and should not be used to make any purchase or sale decision.