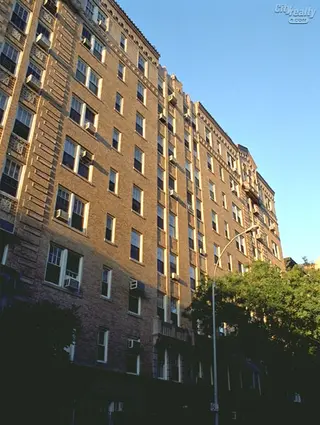
139 West 82nd Street: Price Comparison
between Columbus Avenue & Amsterdam Avenue Building Profile
139 West 82nd Street
$1,300,000
Avg. Price
Past 12 months
Past 12 months
2024
$1,800,000
2023
$815,500
2022
$720,000
2021
$2,787,500
2020
-
2019
$380,000
2018
$1,276,667
2017
$2,053,465
2016
-
2015
$1,165,000
2014
$670,000
2013
$1,555,000
2012
-
2011
$579,500
2010
$600,000
2009
-
2008
$869,000
2007
$599,000
2006
$1,330,833
2005
$1,086,500
2004
-
2003
$478,000
139 West 82nd Street
$1,300,000
Median Price
Past 12 months
Past 12 months
2024
$1,800,000
2023
$815,500
2022
$720,000
2021
$2,787,500
2020
-
2019
$380,000
2018
$1,450,000
2017
$2,053,465
2016
-
2015
$1,435,000
2014
$670,000
2013
$1,555,000
2012
-
2011
$579,500
2010
$600,000
2009
-
2008
$869,000
2007
$599,000
2006
$1,400,000
2005
$1,086,500
2004
-
2003
$415,000
139 West 82nd Street
N/A
Avg. Price
Past 12 months
Past 12 months
2024
-
2023
-
2022
-
2021
-
2020
-
2019
$380,000
2018
-
2017
-
2016
-
2015
-
2014
-
2013
-
2012
-
2011
-
2010
-
2009
-
2008
-
2007
-
2006
-
2005
-
2004
-
2003
-
139 West 82nd Street
N/A
Median Price
Past 12 months
Past 12 months
2024
-
2023
-
2022
-
2021
-
2020
-
2019
$380,000
2018
-
2017
-
2016
-
2015
-
2014
-
2013
-
2012
-
2011
-
2010
-
2009
-
2008
-
2007
-
2006
-
2005
-
2004
-
2003
-
139 West 82nd Street
$905,000
Avg. Price
Past 12 months
Past 12 months
2024
-
2023
$815,500
2022
$700,000
2021
-
2020
-
2019
-
2018
$755,000
2017
-
2016
-
2015
$715,000
2014
$670,000
2013
$660,000
2012
-
2011
$579,500
2010
$600,000
2009
-
2008
$581,000
2007
$599,000
2006
$1,296,250
2005
$660,000
2004
-
2003
$392,333
139 West 82nd Street
$905,000
Median Price
Past 12 months
Past 12 months
2024
-
2023
$815,500
2022
$700,000
2021
-
2020
-
2019
-
2018
$755,000
2017
-
2016
-
2015
$715,000
2014
$670,000
2013
$660,000
2012
-
2011
$579,500
2010
$600,000
2009
-
2008
$581,000
2007
$599,000
2006
$1,296,250
2005
$660,000
2004
-
2003
$410,000
139 West 82nd Street
$1,695,000
Avg. Price
Past 12 months
Past 12 months
2024
$1,500,000
2023
-
2022
-
2021
-
2020
-
2019
-
2018
$1,537,500
2017
-
2016
-
2015
$1,465,000
2014
-
2013
-
2012
-
2011
-
2010
-
2009
-
2008
$1,157,000
2007
-
2006
-
2005
$1,513,000
2004
-
2003
$735,000
139 West 82nd Street
$1,695,000
Median Price
Past 12 months
Past 12 months
2024
$1,500,000
2023
-
2022
-
2021
-
2020
-
2019
-
2018
$1,537,500
2017
-
2016
-
2015
$1,460,000
2014
-
2013
-
2012
-
2011
-
2010
-
2009
-
2008
$1,157,000
2007
-
2006
-
2005
$1,513,000
2004
-
2003
$735,000
139 West 82nd Street
N/A
Avg. Price
Past 12 months
Past 12 months
2024
$2,100,000
2023
-
2022
-
2021
$2,787,500
2020
-
2019
-
2018
-
2017
$2,053,465
2016
-
2015
-
2014
-
2013
$2,450,000
2012
-
2011
-
2010
-
2009
-
2008
-
2007
-
2006
$1,400,000
2005
-
2004
-
2003
-
139 West 82nd Street
N/A
Median Price
Past 12 months
Past 12 months
2024
$2,100,000
2023
-
2022
-
2021
$2,787,500
2020
-
2019
-
2018
-
2017
$2,053,465
2016
-
2015
-
2014
-
2013
$2,450,000
2012
-
2011
-
2010
-
2009
-
2008
-
2007
-
2006
$1,400,000
2005
-
2004
-
2003
-
139 West 82nd Street
N/A
Avg. Price
Past 12 months
Past 12 months
2024
-
2023
-
2022
-
2021
-
2020
-
2019
-
2018
-
2017
-
2016
-
2015
-
2014
-
2013
-
2012
-
2011
-
2010
-
2009
-
2008
-
2007
-
2006
-
2005
-
2004
-
2003
-
139 West 82nd Street
N/A
Median Price
Past 12 months
Past 12 months
2024
-
2023
-
2022
-
2021
-
2020
-
2019
-
2018
-
2017
-
2016
-
2015
-
2014
-
2013
-
2012
-
2011
-
2010
-
2009
-
2008
-
2007
-
2006
-
2005
-
2004
-
2003
-
139 West 82nd Street
N/A
Avg. Price
Past 12 months
Past 12 months
2024
-
2023
-
2022
-
2021
-
2020
-
2019
-
2018
-
2017
-
2016
-
2015
-
2014
-
2013
-
2012
-
2011
-
2010
-
2009
-
2008
-
2007
-
2006
-
2005
-
2004
-
2003
-
139 West 82nd Street
N/A
Median Price
Past 12 months
Past 12 months
2024
-
2023
-
2022
-
2021
-
2020
-
2019
-
2018
-
2017
-
2016
-
2015
-
2014
-
2013
-
2012
-
2011
-
2010
-
2009
-
2008
-
2007
-
2006
-
2005
-
2004
-
2003
-

 6sqft delivers the latest on real estate, architecture, and design, straight from New York City.
