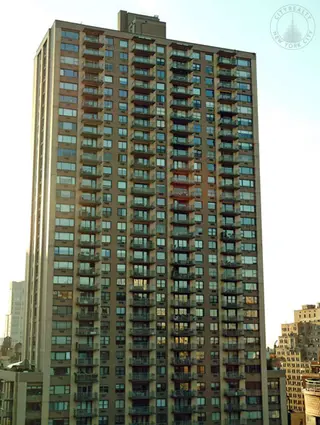
Sherman Square, 201 West 70th Street - Upper West Side
- Apartments
- Overview & Photos
- Maps
- Floorplans
- Sales Data & Comps
- Similar Buildings
- All Units
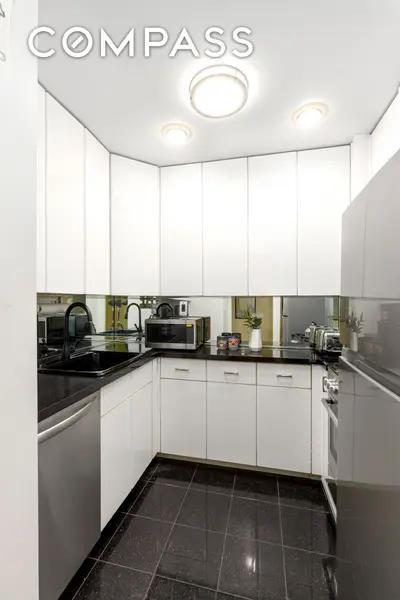
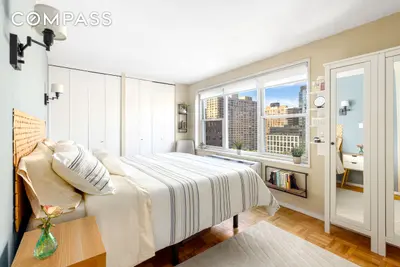
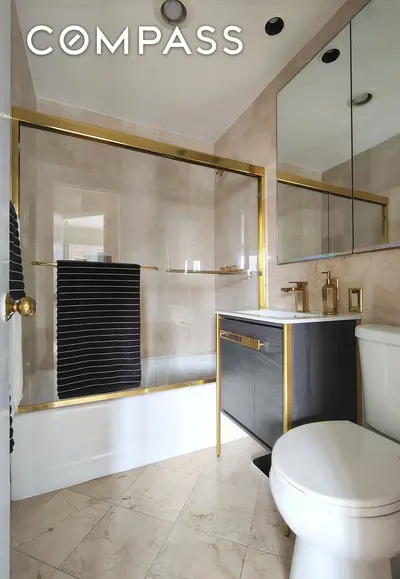

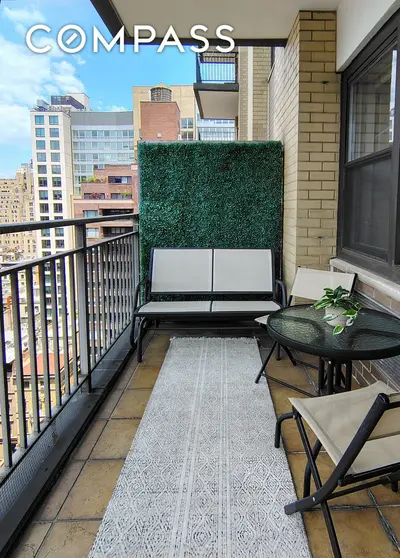
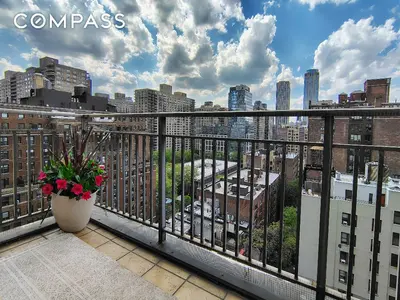

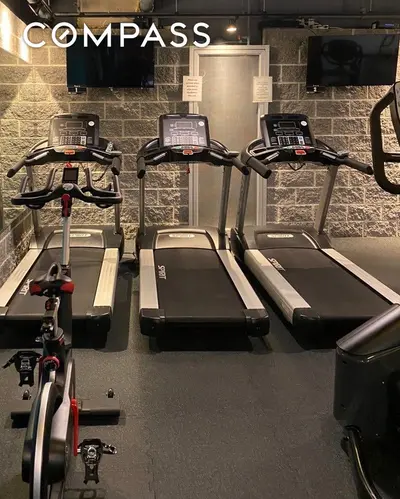
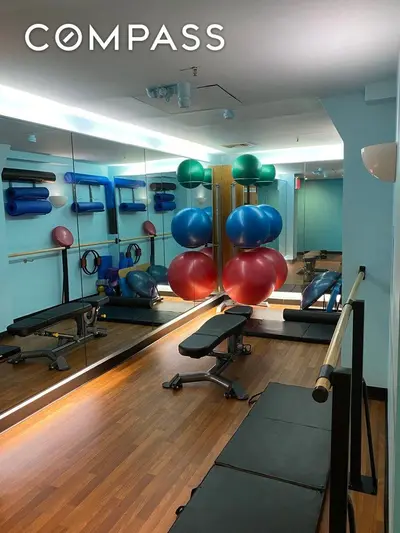
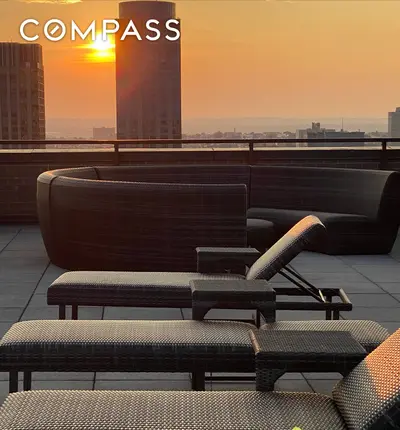
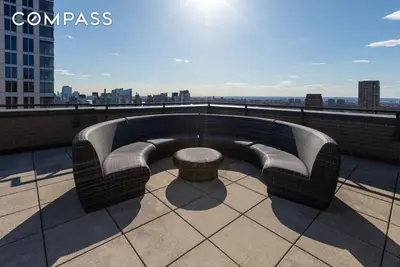

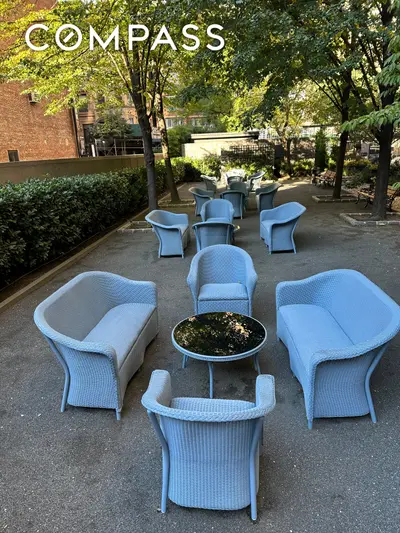
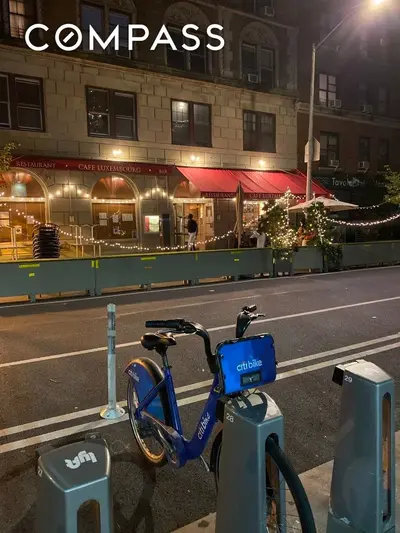
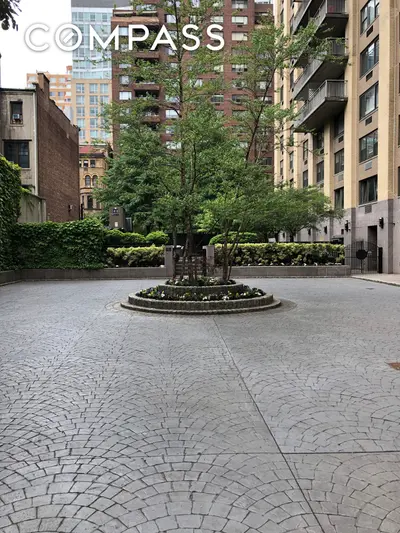
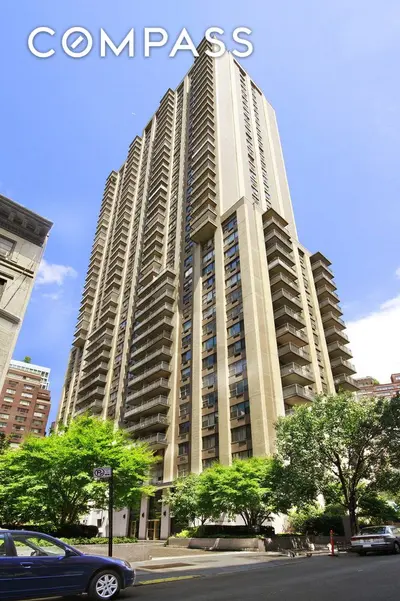

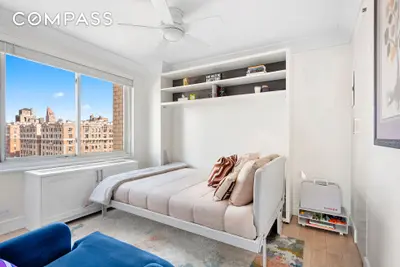
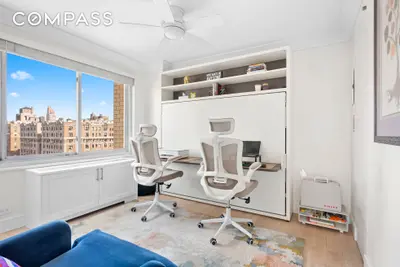
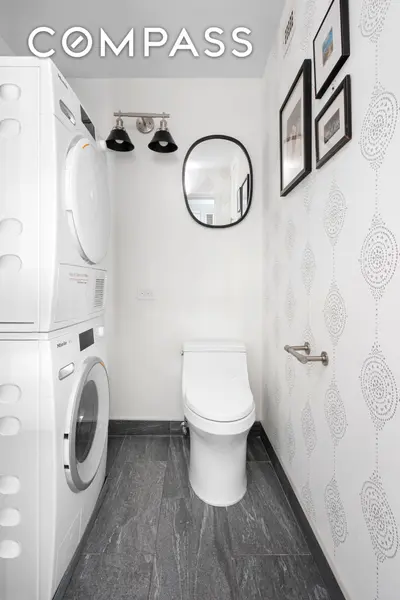
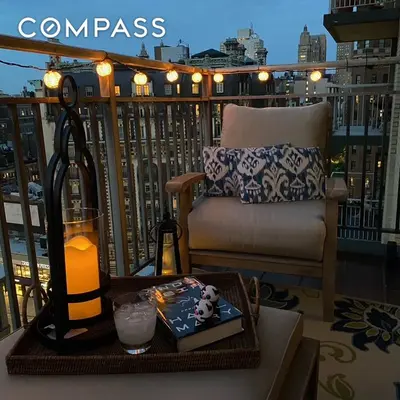


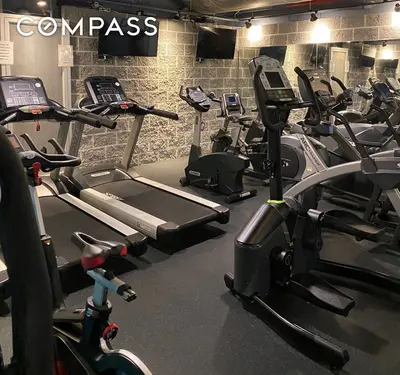
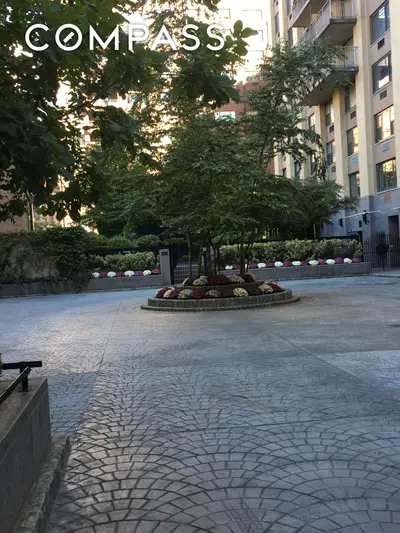
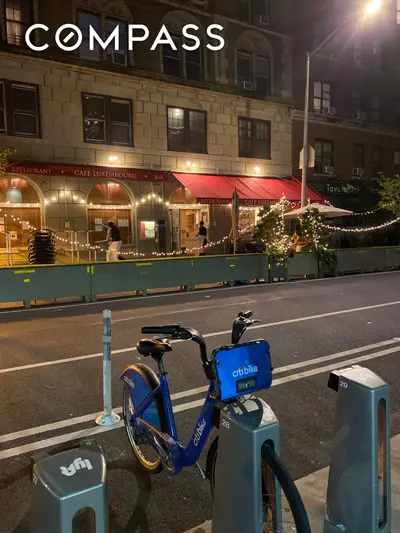
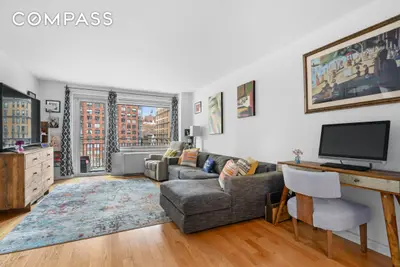
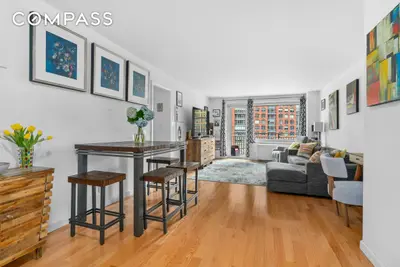
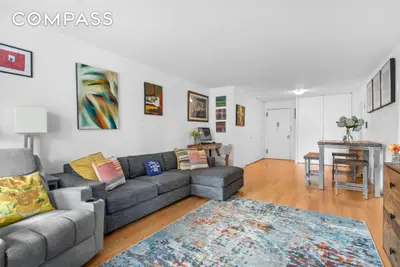
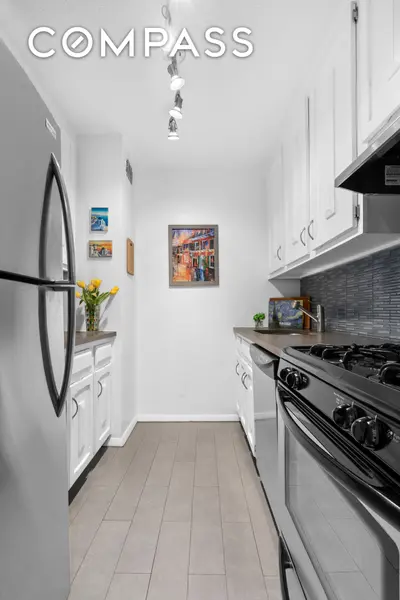
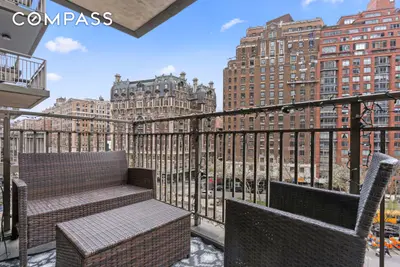
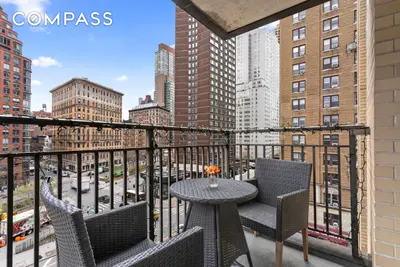
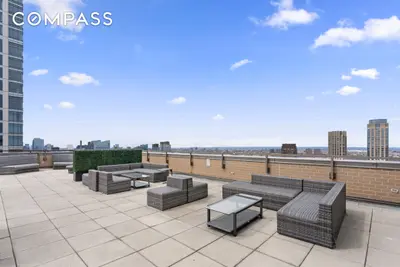
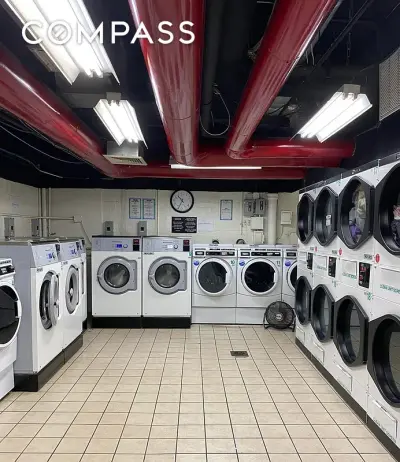
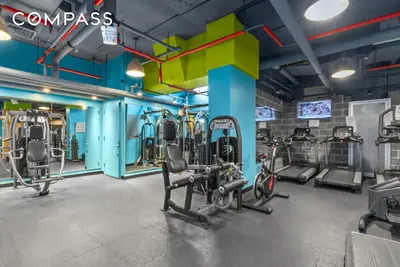
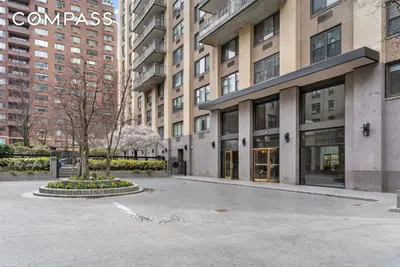
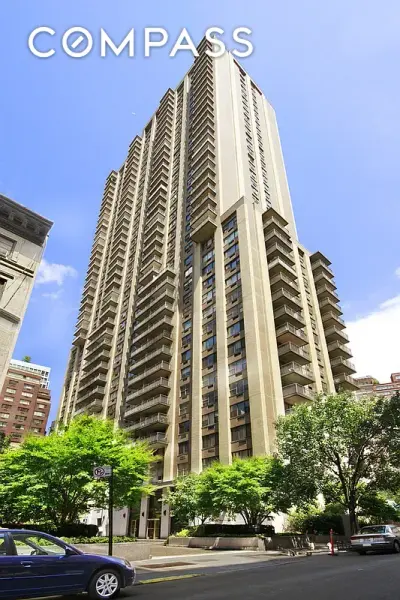
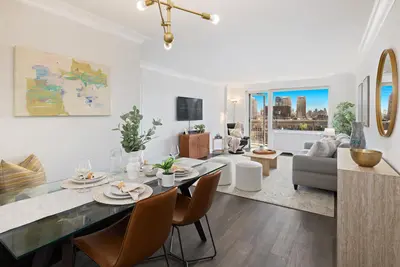
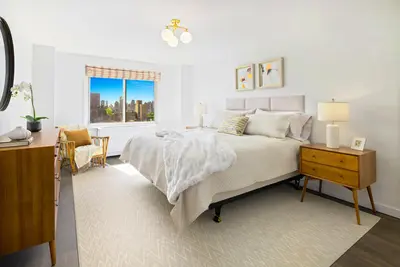
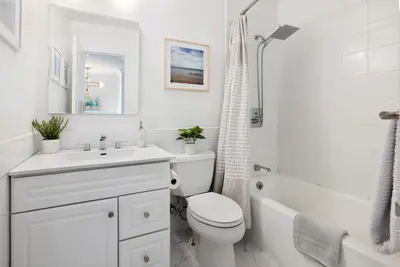
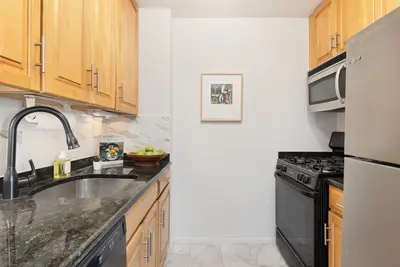


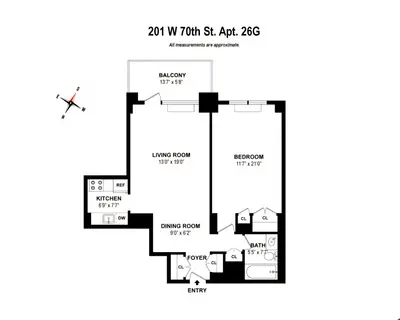
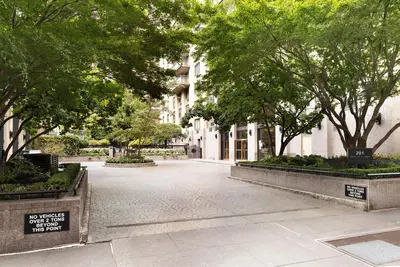

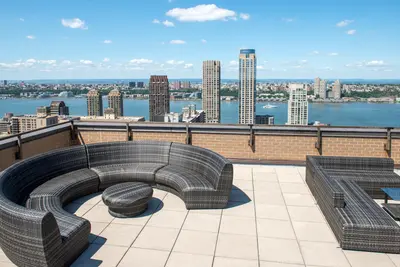

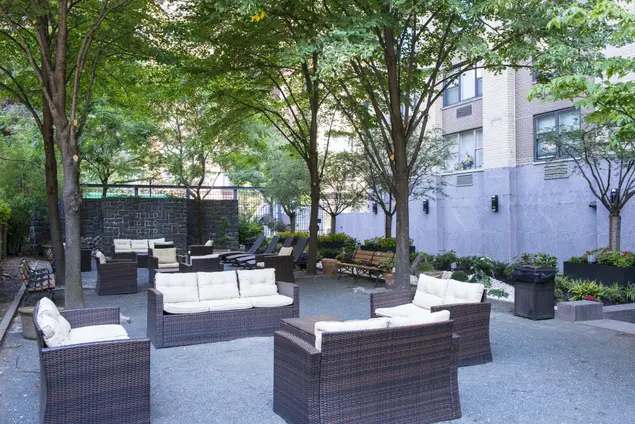
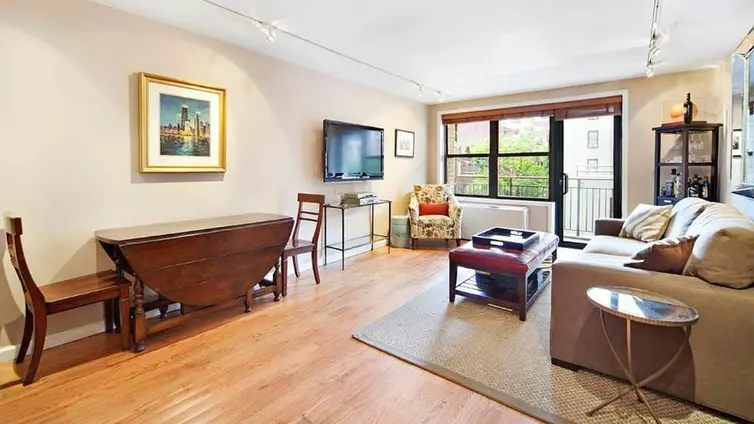
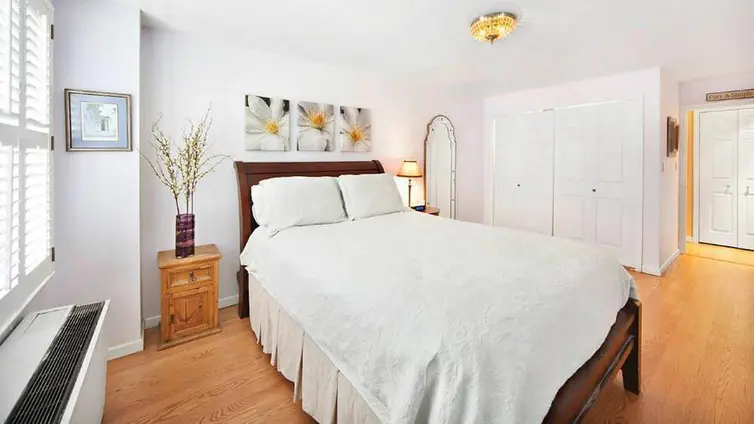
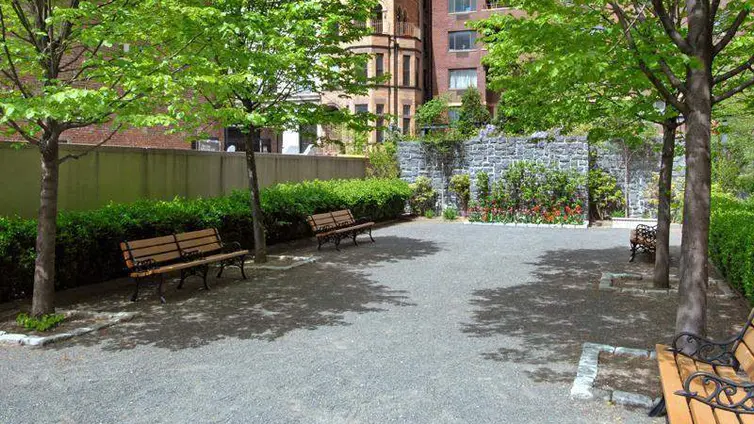
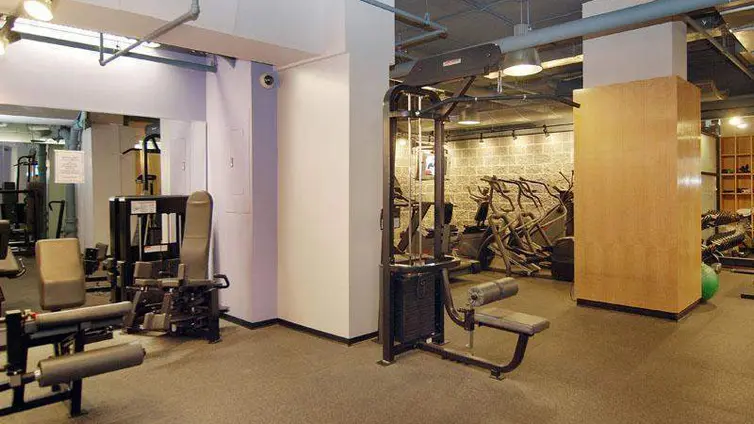
Sherman Square is a 42-story, 328-unit post-war cooperative finished in 1972. Washer/dryers, pets, and pied a terres are allowed, and amenities and staff include 24-hour doorman, concierge, gym, central laundry room, roof deck, driveway for loading and unloading, and parking. Its address at 201 West 70th Street puts it close to Lincoln Center, Central Park, top Upper West Side restaurants, and the 72nd Street subway.


View school info, local attractions, transportation options & more.
Experience amazing 3D aerial maps and fly throughs.
For some co-ops, instead of price per square foot, we use an estimate of the number of rooms for each sold apartment to chart price changes over time. This is because many co-op listings do not include square footage information, and this makes it challenging to calculate accurate square-foot averages.
By displaying the price per estimated room count, we are able to provide a more reliable and consistent metric for comparing sales in the building. While we hope that this gives you a clearer sense of price trends in the building, all data should be independently verified. All data provided are only estimates and should not be used to make any purchase or sale decision.
Broker & Buyer Comments