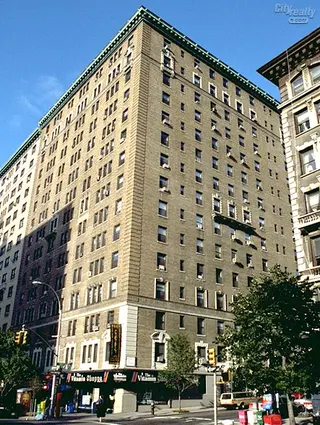
The Clayton, 215 West 92nd Street - Upper West Side
- Apartments
- Overview & Photos
- Maps
- Floorplans
- Sales Data & Comps
- Similar Buildings
- All Units
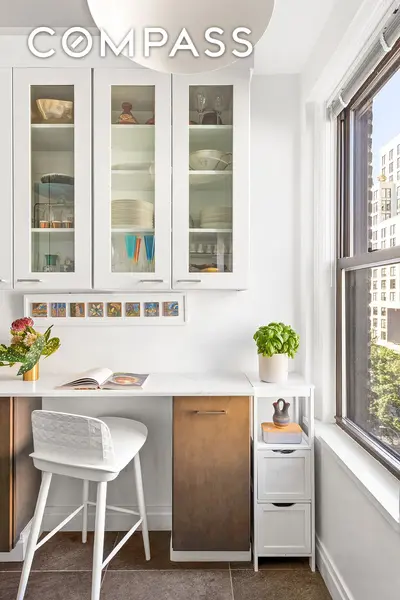
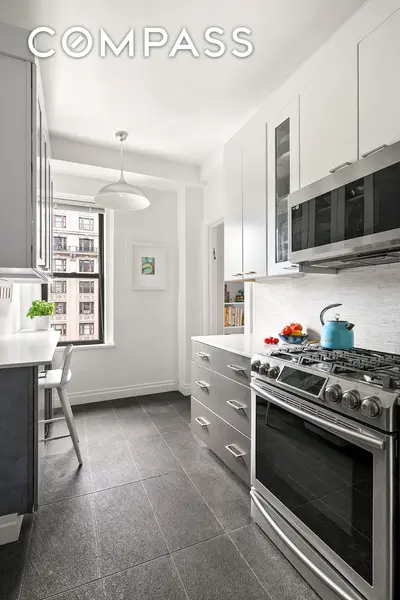
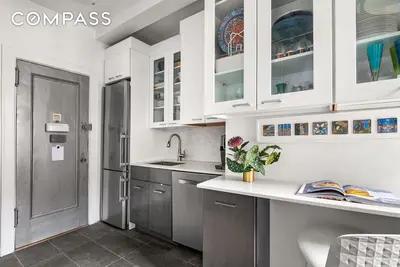
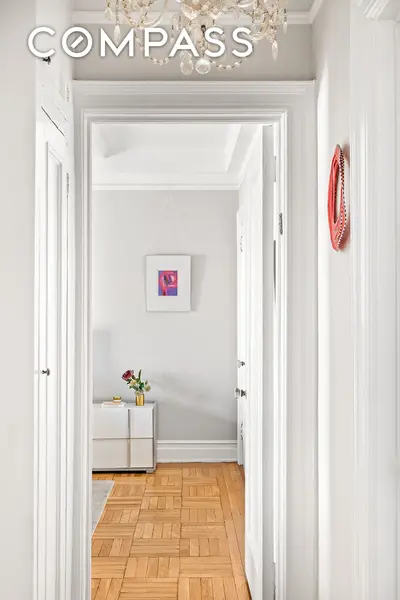
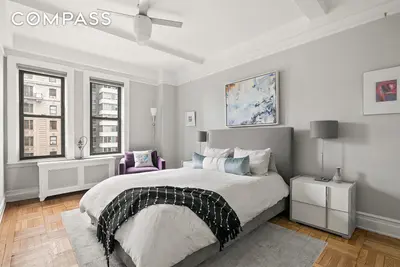
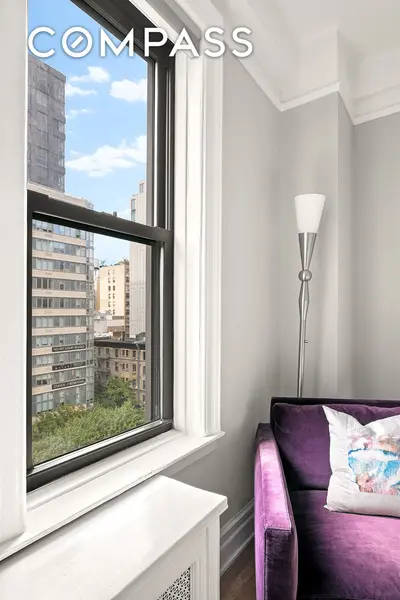
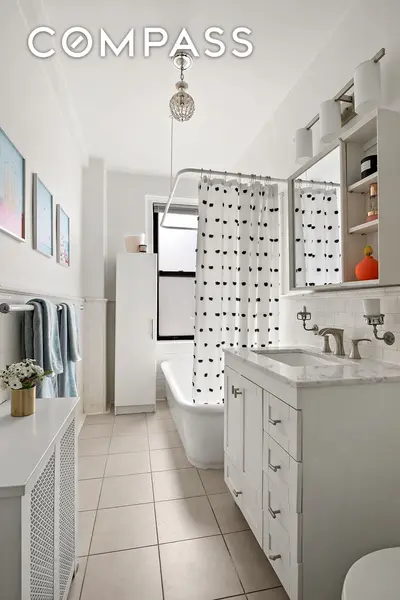
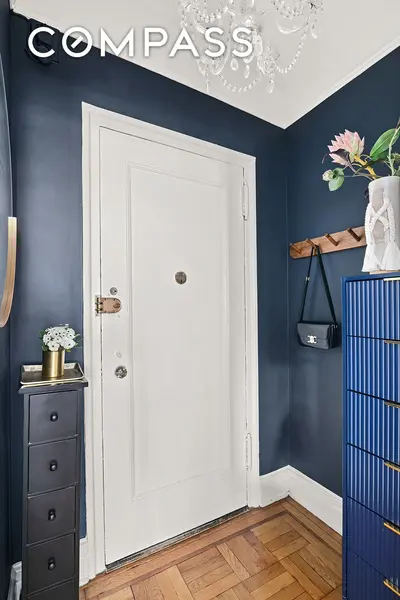
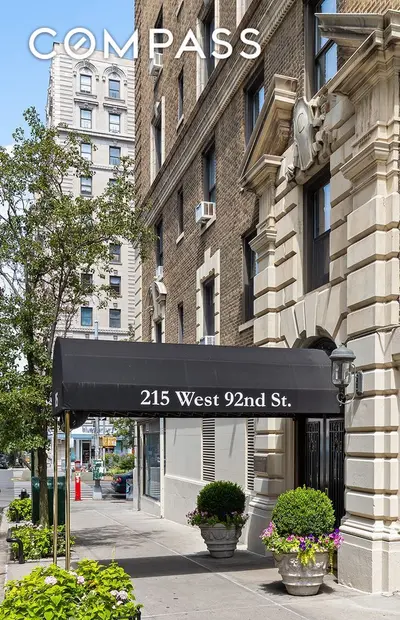
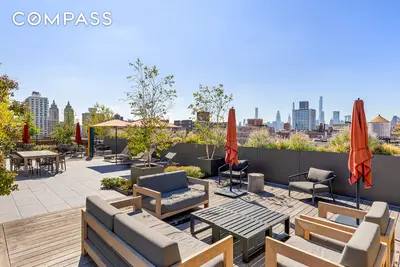
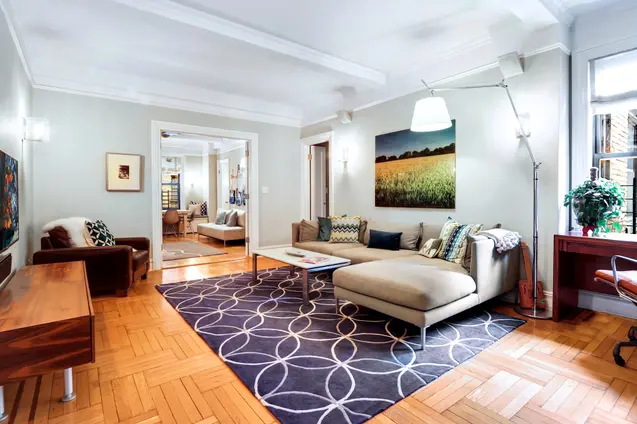
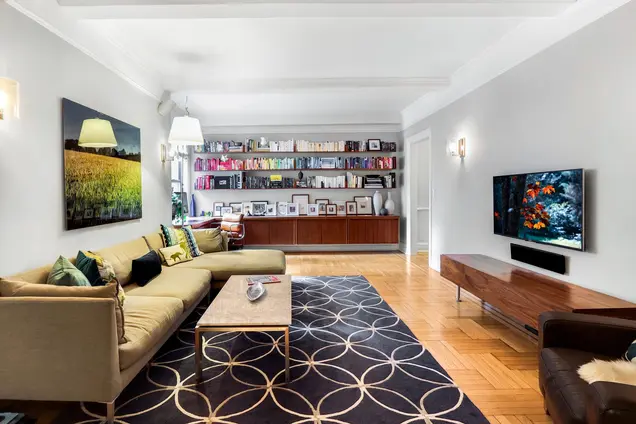
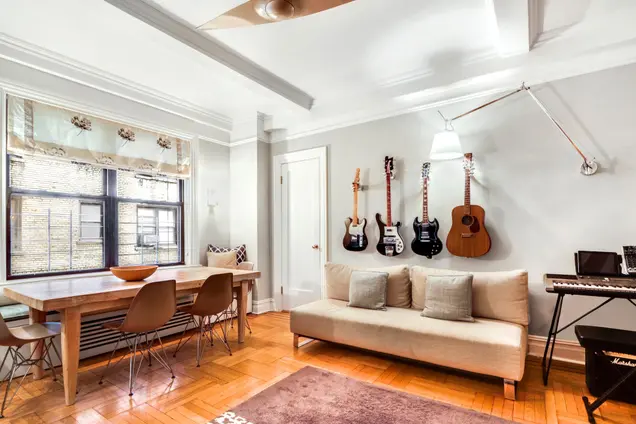
The Clayton rises over the intersection of Broadway and West 92nd Street. The imposing, Renaissance-styled palazzo was completed in 1924 and ranked among the first private commissions for Rosario Candela, who would go on to become one of New York’s all-time greatest apartment building architects. The 16-story co-op offers a full-time doorman, a children’s playroom, a laundry room, washers and dryers in select units, and terraces at the penthouse level. The bike room comes handy for leisurely rides down Central Park and Riverside Park, both located nearby and accessible via nearby crosstown bike lanes on West 90th and West 91st streets. The Upper West Side’s myriad cultural and culinary delights lie within equally easy reach, while the nearby 96th Street station of the 1, 2, and 3 trains offers convenient commute options.


View school info, local attractions, transportation options & more.
Experience amazing 3D aerial maps and fly throughs.
For some co-ops, instead of price per square foot, we use an estimate of the number of rooms for each sold apartment to chart price changes over time. This is because many co-op listings do not include square footage information, and this makes it challenging to calculate accurate square-foot averages.
By displaying the price per estimated room count, we are able to provide a more reliable and consistent metric for comparing sales in the building. While we hope that this gives you a clearer sense of price trends in the building, all data should be independently verified. All data provided are only estimates and should not be used to make any purchase or sale decision.


