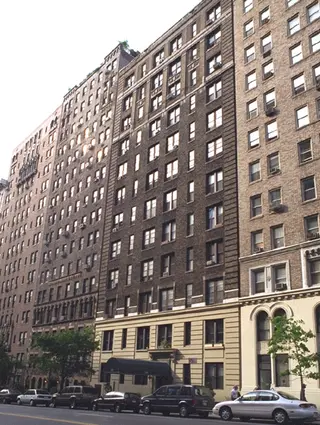
The Lyons, 135 West 79th Street: Sales Summary
between Columbus Avenue & Amsterdam Avenue Building Profile
All Sales
$1,032
Avg. Price / ft2
Past 12 months, based on 2 sales
$800,000
Avg. Price -
Past 12 months, based on 2 sales
$1,032
Median Price / ft2
Past 12 months, based on 2 sales
$800,000
Median Price
Past 12 months, based on 2 sales
Year
Avg Price / Ft2
Median Price / Ft2
Avg. Actual Price
Med. Actual Price
Transactions
2025
-
-
-
-
0
2024
$1,032
$795,000
$1,032
$785,000
3
2023
$1,163
$1,033,802
$1,163
$930,000
3
2022
$1,076
$1,587,000
$1,076
$861,000
3
2021
-
$1,150,000
-
$1,150,000
1
2020
$938
$750,000
$938
$750,000
1
2019
-
$790,000
-
$790,000
1
2018
$869
$863,750
$869
$710,000
4
2017
$1,010
$974,500
$1,010
$762,500
5
2016
$1,026
$752,500
$1,026
$752,500
2
2015
$972
$752,000
$972
$752,000
2
2014
$1,053
$912,833
$1,053
$737,000
3
2013
-
$1,165,000
-
$1,165,000
1
Year
Avg Price / Ft2
Median Price / Ft2
Avg. Actual Price
Med. Actual Price
Transactions
2012
$855
$599,875
$855
$582,500
4
2011
$883
$831,248
$883
$831,248
2
2010
$903
$802,250
$903
$802,250
2
2009
$845
$818,583
$845
$910,000
3
2008
$950
$760,000
$950
$760,000
1
2007
$909
$902,959
$909
$978,418
4
2006
$906
$866,333
$906
$994,000
3
2005
$887
$724,657
$886
$657,314
4
2004
$716
$586,358
$716
$564,715
4
2003
$672
$600,400
$672
$725,000
5
The Breakdown of All Sales by Apartment Size