Westwind, 175 West 93rd Street - Upper West Side
- Apartments
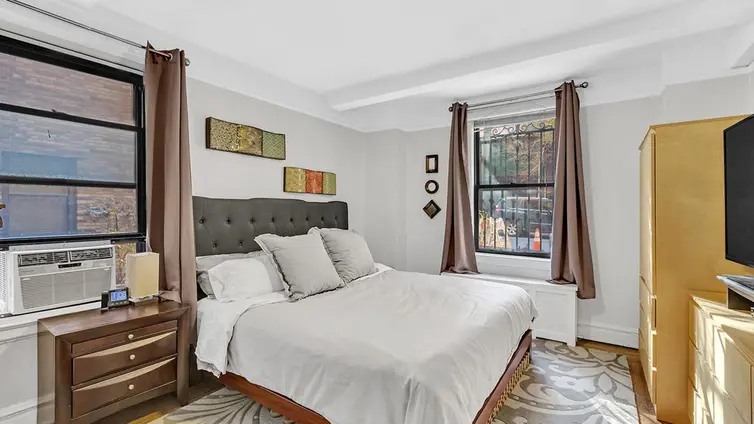
- Overview & Photos
- Maps
- Floorplans
- Sales Data & Comps
- Similar Buildings
- All Units
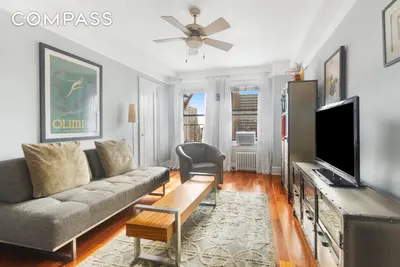
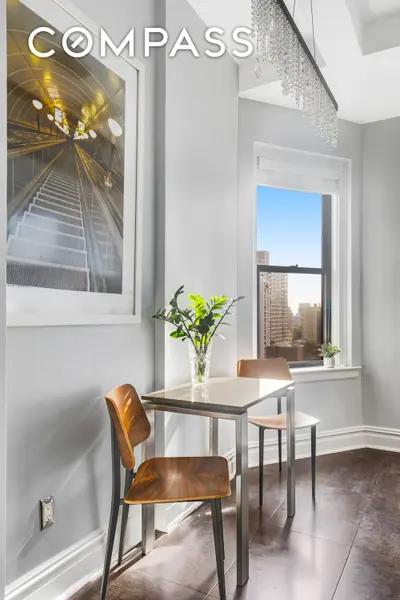
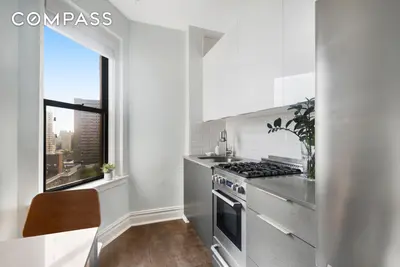
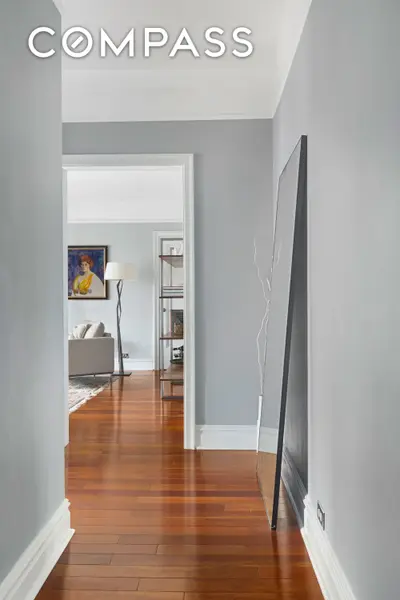

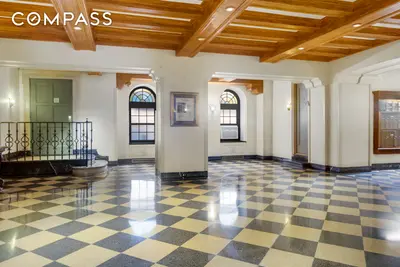
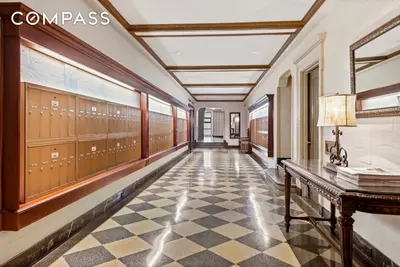
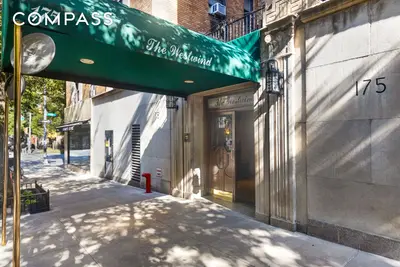
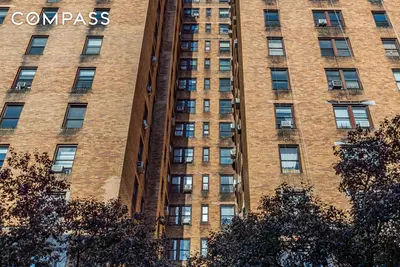
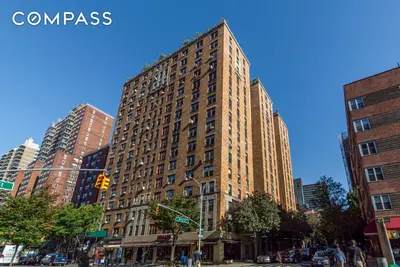

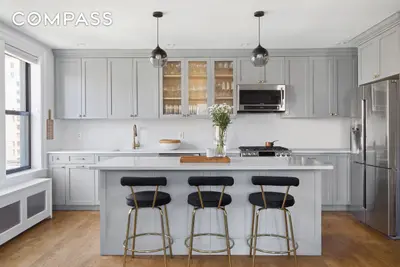


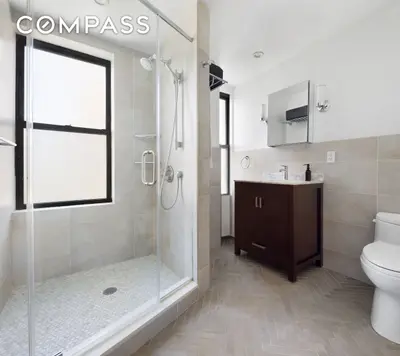
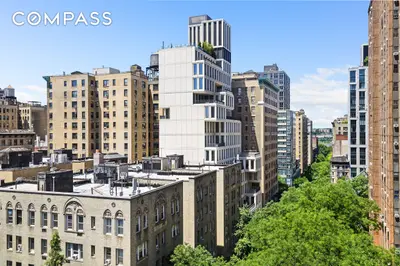


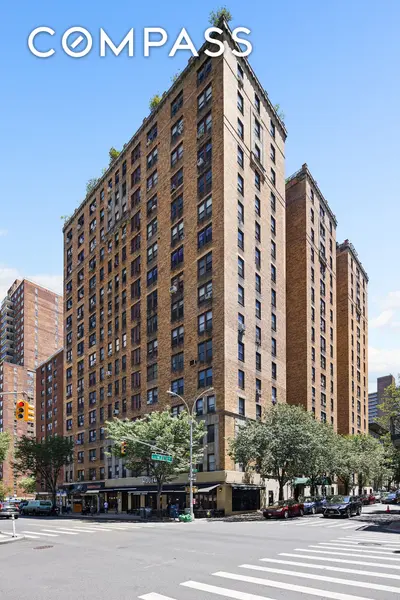
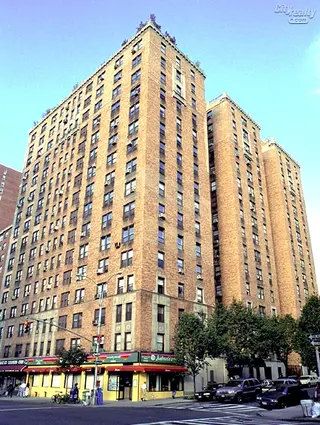
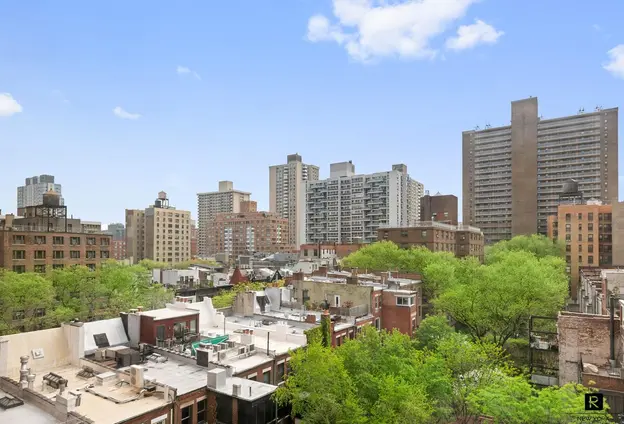
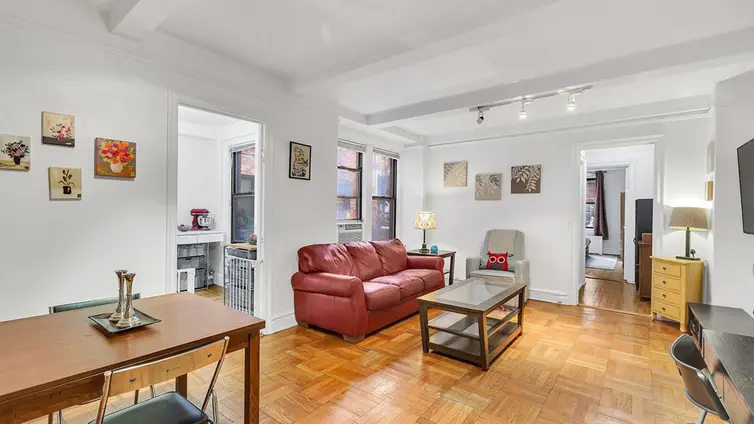
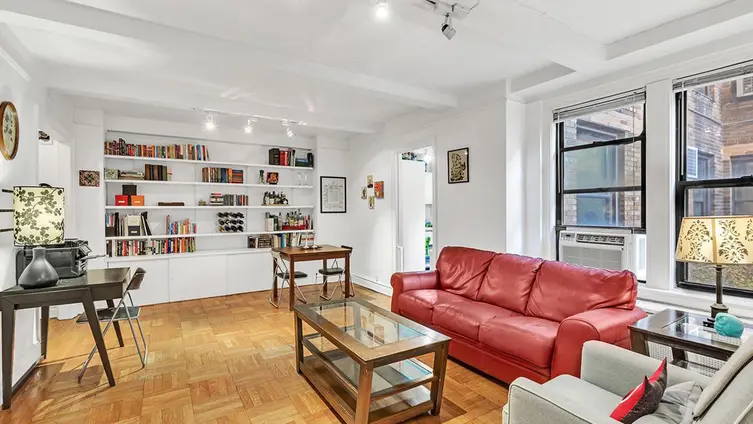
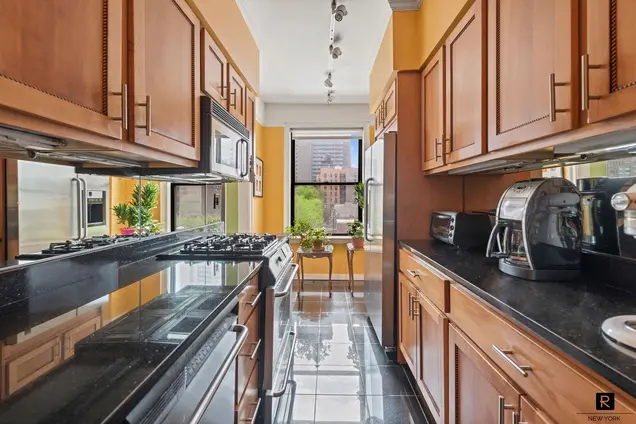
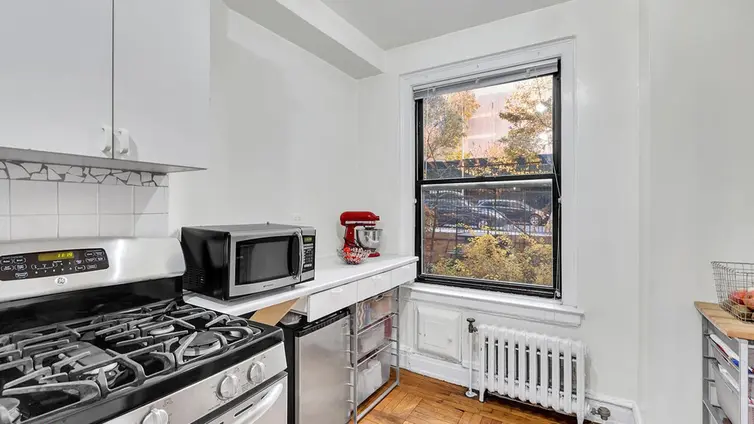
Westwind is a 16-story building located at 175 West 93rd Street, designed by Rosario Candela in 1924 and converted to a 175-unit cooperative in 1984. Amenities and staff include a full-time doorman, live-in resident manager, beautifully restored lobby, bike room, laundry room, and private storage.
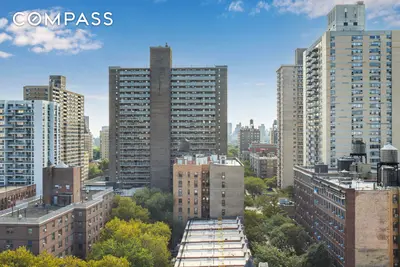
Pied-a-terres and co-purchasing are permitted on a case-by-case basis, and washer/dryers are permitted with board approval. Its Upper West Side address puts it in excellent proximity to Riverside Park, Central Park, Trader Joe's, Whole Foods, Columbus Square shopping, popular restaurants, and the 1/2/3 and B/C subway stops.

View school info, local attractions, transportation options & more.
Experience amazing 3D aerial maps and fly throughs.
For some co-ops, instead of price per square foot, we use an estimate of the number of rooms for each sold apartment to chart price changes over time. This is because many co-op listings do not include square footage information, and this makes it challenging to calculate accurate square-foot averages.
By displaying the price per estimated room count, we are able to provide a more reliable and consistent metric for comparing sales in the building. While we hope that this gives you a clearer sense of price trends in the building, all data should be independently verified. All data provided are only estimates and should not be used to make any purchase or sale decision.