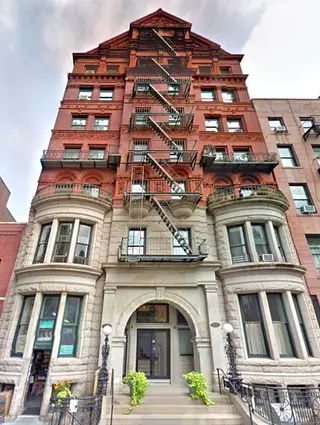
105 Montague Street: Sales Summary
between Hicks Street & Henry Street Building Profile
All Sales
$0
Avg. Price / ft2
Past 12 months, based on 1 sale
$1,325,000
Avg. Price -
Past 12 months, based on 1 sale
$0
Median Price / ft2
Past 12 months, based on 1 sale
$1,325,000
Median Price
Past 12 months, based on 1 sale
Year
Avg Price / Ft2
Median Price / Ft2
Avg. Actual Price
Med. Actual Price
Transactions
2025
-
-
-
-
0
2024
$946
$1,230,000
$946
$1,230,000
2
2023
$1,219
$1,282,000
$1,226
$1,325,000
5
2022
-
$1,517,500
-
$1,517,500
2
2021
$1,205
$1,152,500
$1,205
$1,152,500
2
2020
-
$1,395,000
-
$1,395,000
1
2019
-
-
-
-
0
2018
-
$1,325,000
-
$1,325,000
1
2017
$1,182
$1,300,000
$1,182
$1,300,000
1
2016
$1,142
$1,237,500
$1,142
$1,237,500
2
2015
$809
$1,179,833
$809
$1,300,000
3
2014
$864
$950,000
$864
$950,000
1
2013
$675
$883,250
$675
$883,250
2
Year
Avg Price / Ft2
Median Price / Ft2
Avg. Actual Price
Med. Actual Price
Transactions
2012
$691
$555,000
$691
$555,000
2
2011
$663
$704,000
$615
$677,000
3
2010
$682
$780,667
$682
$787,000
3
2009
-
$800,000
$800,000
1
2008
$779
$1,087,000
$779
$1,087,000
2
2007
$592
$743,500
$592
$743,500
2
2006
$663
$700,625
$675
$757,500
4
2005
$721
$782,500
$721
$782,500
2
2004
$542
$690,000
$542
$690,000
3
2003
$440
$372,634
$440
$475,000
3
The Breakdown of All Sales by Apartment Size