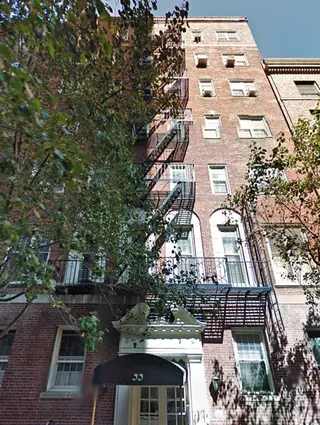
Hamilton House, 55 Pineapple Street - Brooklyn Heights
- Apartments
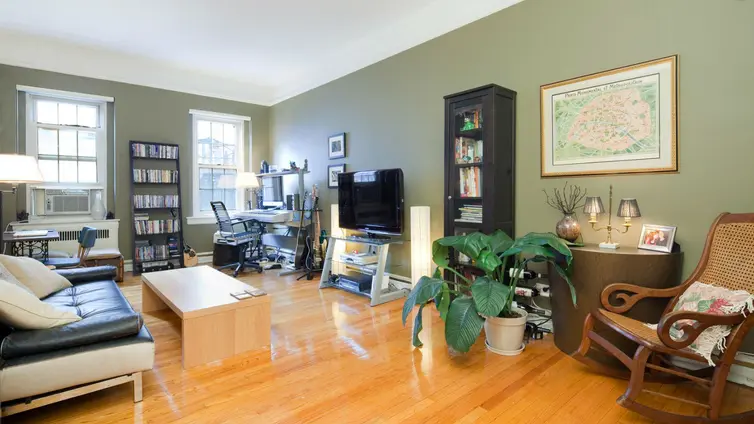
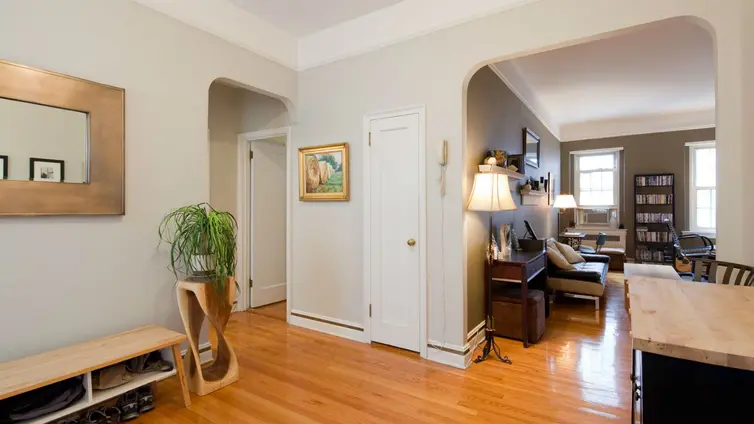
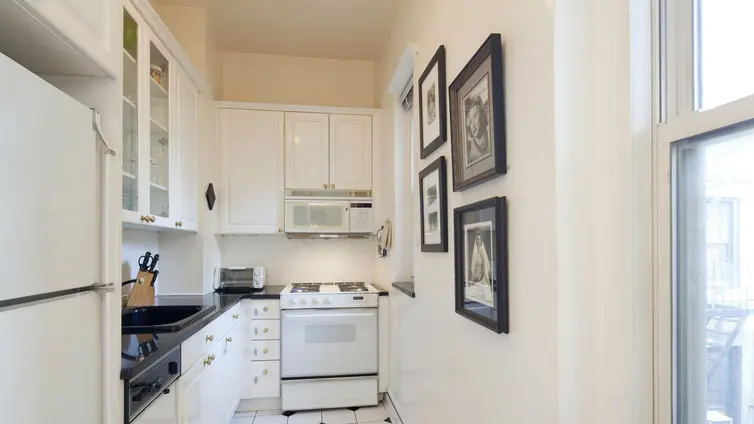
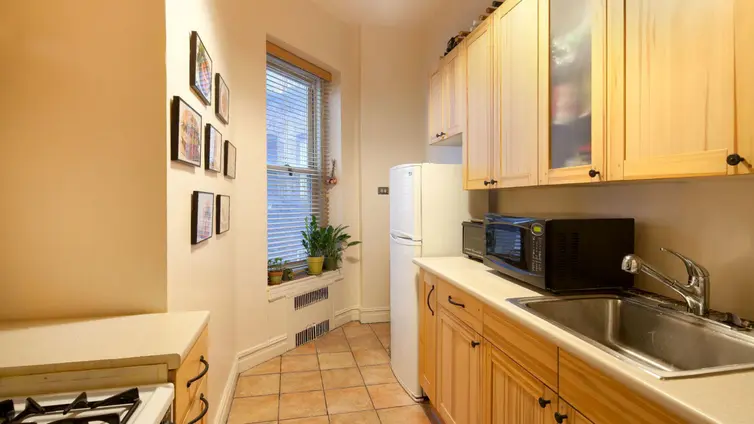
- Overview & Photos
- Maps
- Floorplans
- Sales Data & Comps
- Similar Buildings
- All Units
55 Pineapple Street is a pre-war cooperative located on a peaceful tree-lined street in Brooklyn Heights., The building is steps from excellent restaurants, cafés, and bars along Henry Street and a short walk from the Brooklyn Bridge Park, Brooklyn Heights Promenade, and the bustling Atlantic Avenue and Court Street. 55 Pineapple Street is within two blocks of the A, C, 2 & 3 subway lines.
The building offers a live-in superintendent, laundry room, bike room, and courtyard. The building does not allow dogs.


View school info, local attractions, transportation options & more.
Experience amazing 3D aerial maps and fly throughs.
For some co-ops, instead of price per square foot, we use an estimate of the number of rooms for each sold apartment to chart price changes over time. This is because many co-op listings do not include square footage information, and this makes it challenging to calculate accurate square-foot averages.
By displaying the price per estimated room count, we are able to provide a more reliable and consistent metric for comparing sales in the building. While we hope that this gives you a clearer sense of price trends in the building, all data should be independently verified. All data provided are only estimates and should not be used to make any purchase or sale decision.