The Remsen, 70 Remsen Street - Brooklyn Heights
- Apartments
- Overview & Photos
- Maps
- Floorplans
- Sales Data & Comps
- Similar Buildings
- All Units


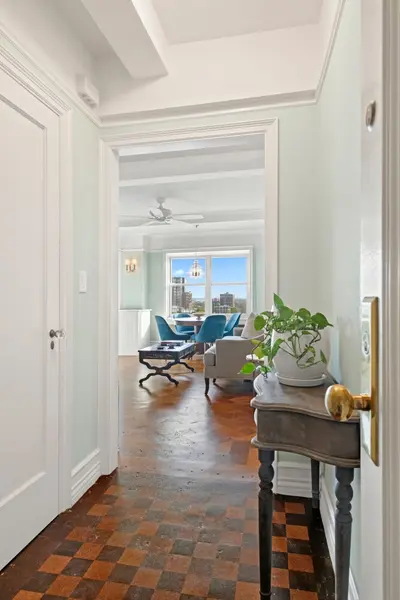
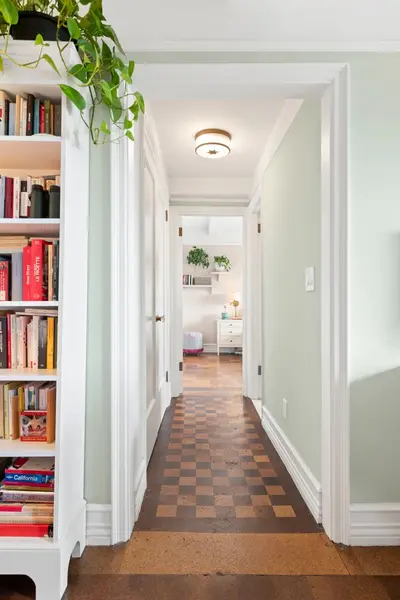
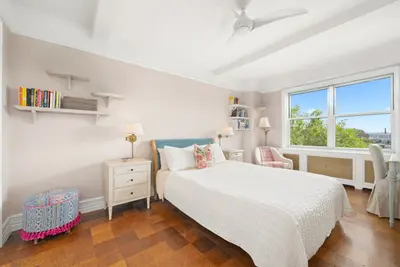
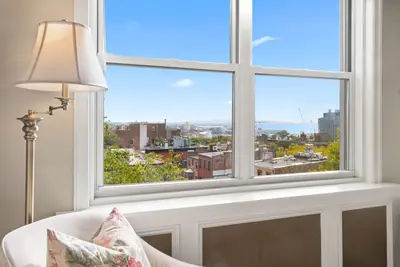
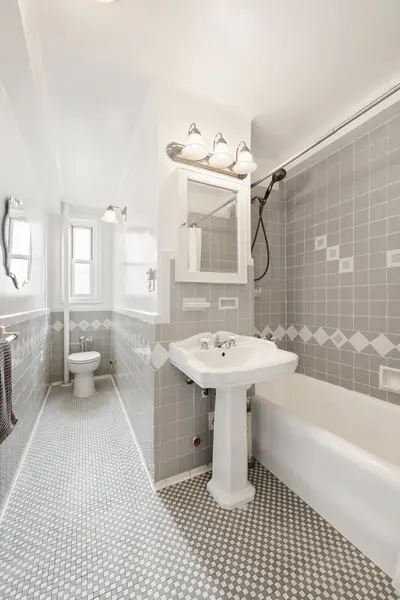
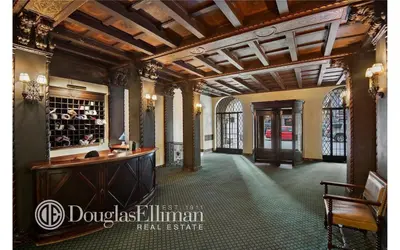
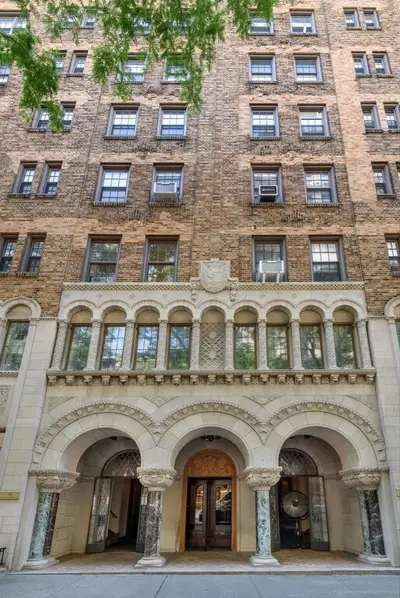
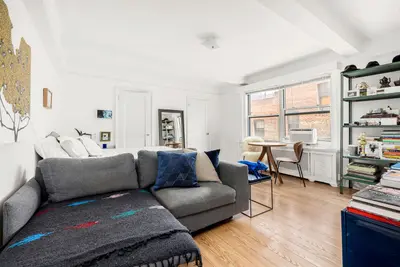
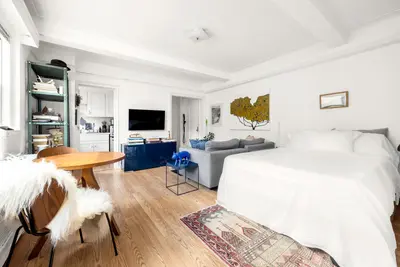
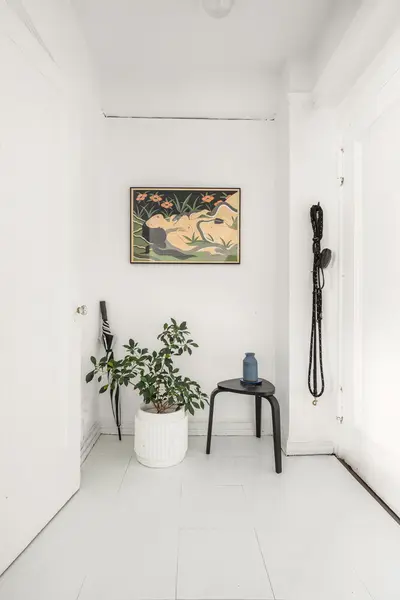
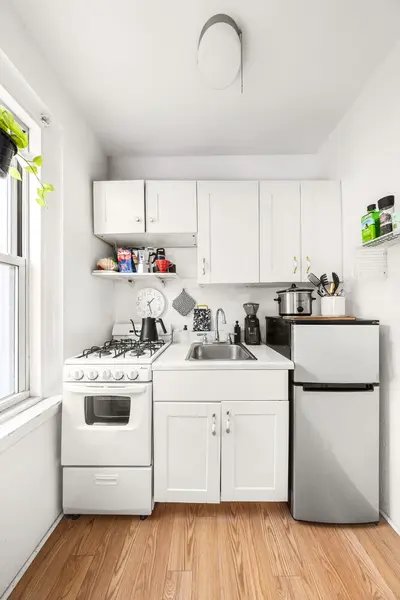
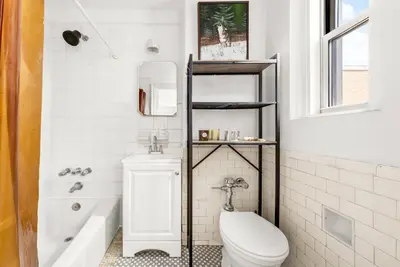
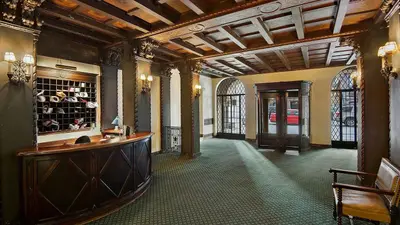
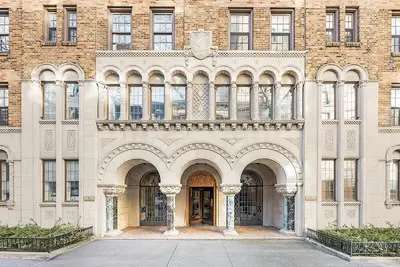

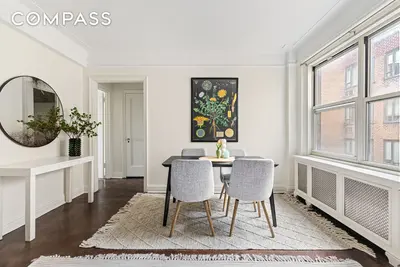

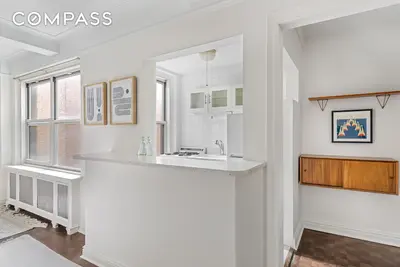
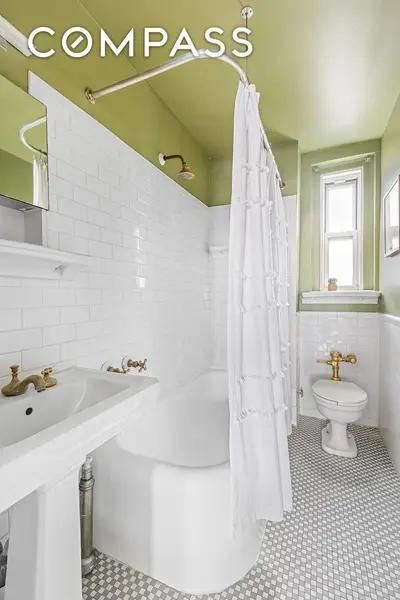
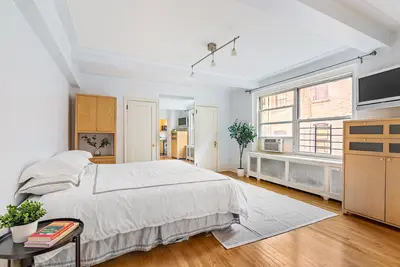
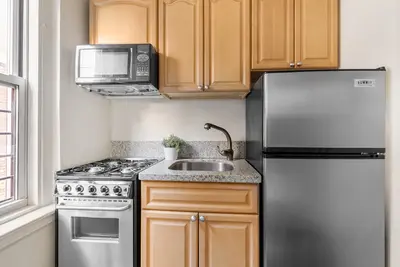
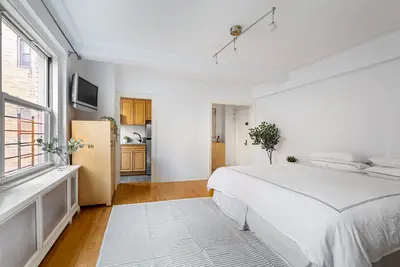
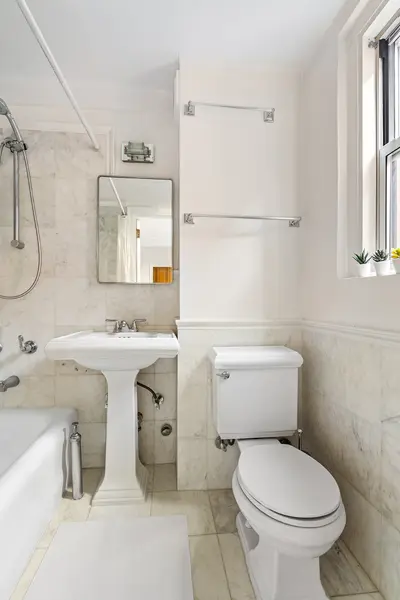
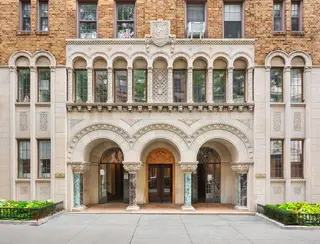
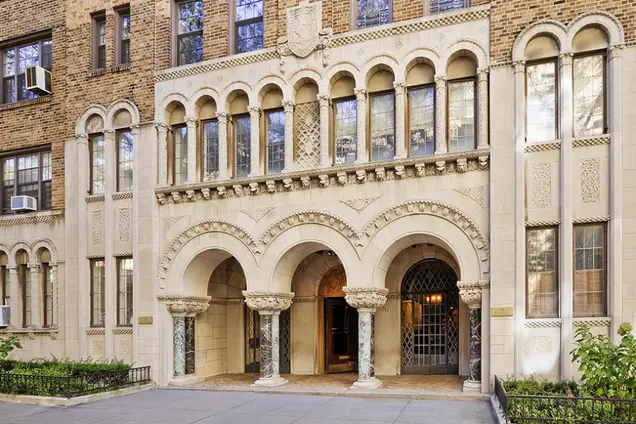
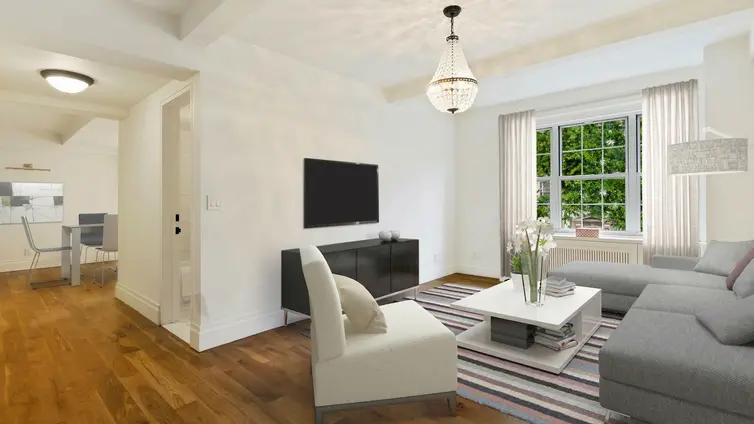
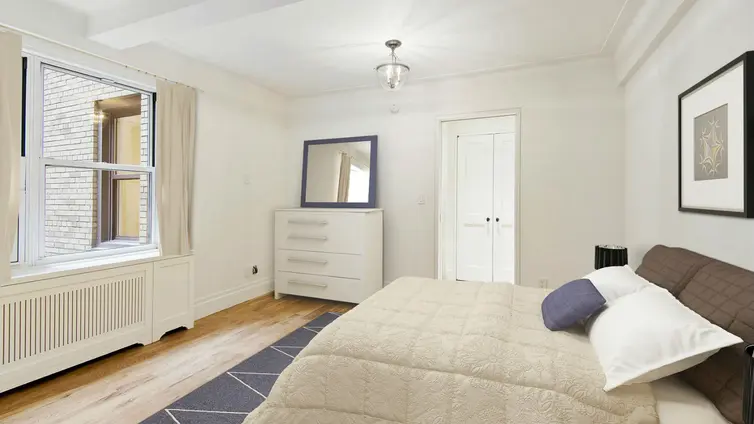
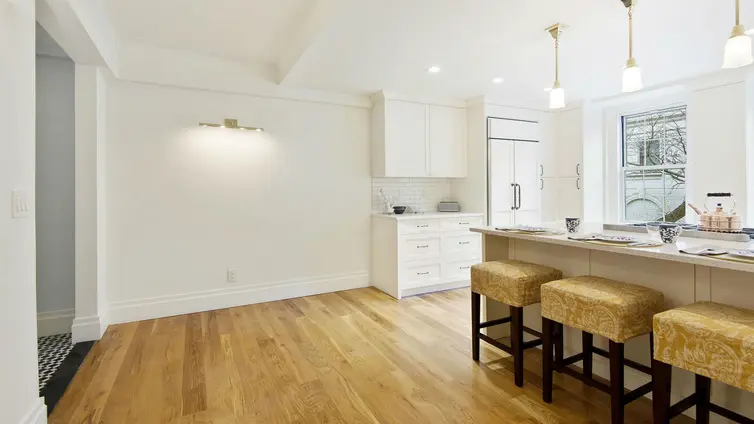
The Remsen is a 10-story cooperative designed by H.I. Feldman and finished in 1928. A 24/7 doorman/concierge and live-in superintendent are on staff, and amenities include an ornate lobby, a central laundry room, and a bike room. It is located at 70 Remsen Street in a prime Brooklyn Heights location near the Brooklyn Heights Promenade, Brooklyn Bridge Park, Trader Joe's, charming neighborhood restaurants and cafes, and all major transportation. Maintenance includes all utilities, and the building has liberal policies for sublets. Pets and pied-a-terres are welcome.


View school info, local attractions, transportation options & more.
Experience amazing 3D aerial maps and fly throughs.
For some co-ops, instead of price per square foot, we use an estimate of the number of rooms for each sold apartment to chart price changes over time. This is because many co-op listings do not include square footage information, and this makes it challenging to calculate accurate square-foot averages.
By displaying the price per estimated room count, we are able to provide a more reliable and consistent metric for comparing sales in the building. While we hope that this gives you a clearer sense of price trends in the building, all data should be independently verified. All data provided are only estimates and should not be used to make any purchase or sale decision.