Shh... Many units sell without being publicly listed.
Interested in off-market listings at 1158 Fifth Avenue? Some previously listed residences might be available – contact us for insider details on potential opportunities!
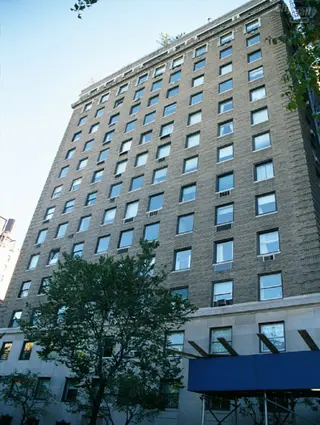
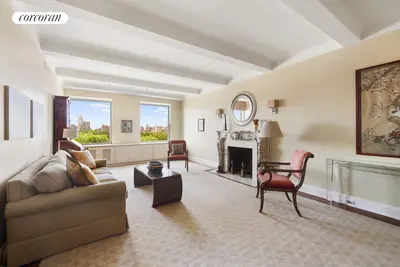
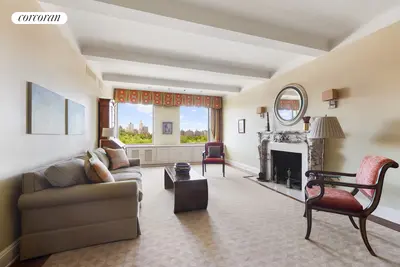
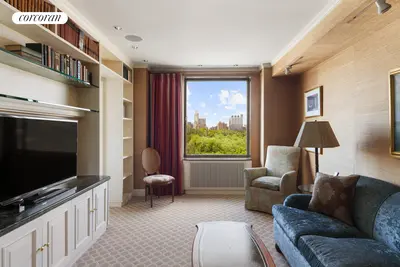
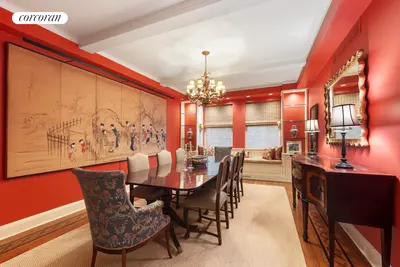
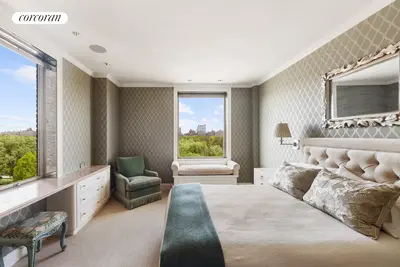
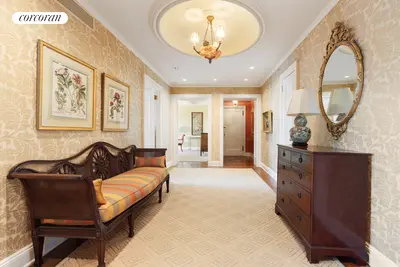


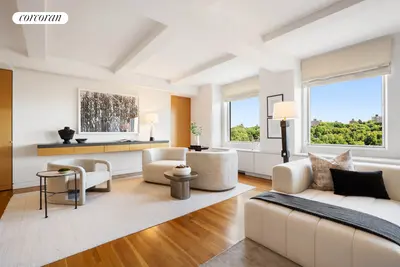

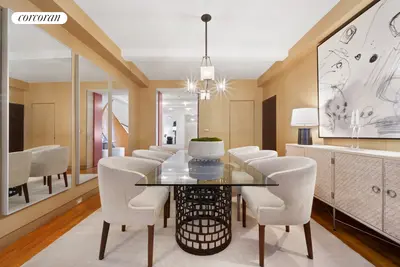
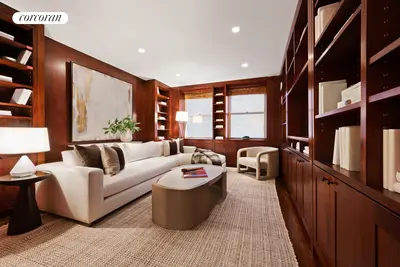
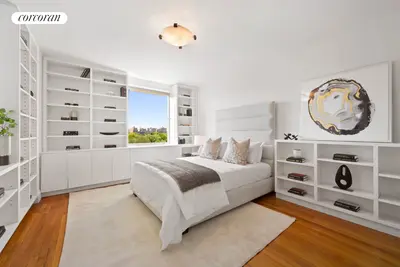
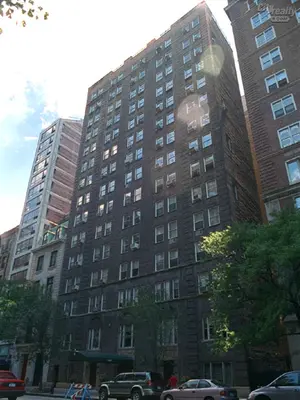
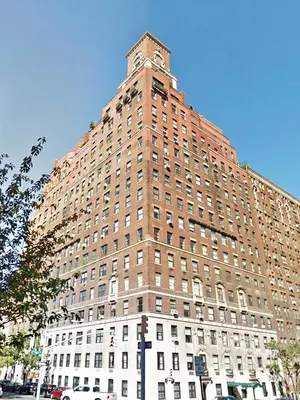
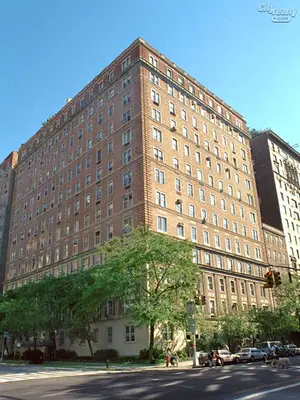
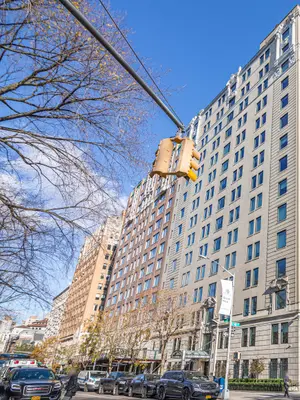
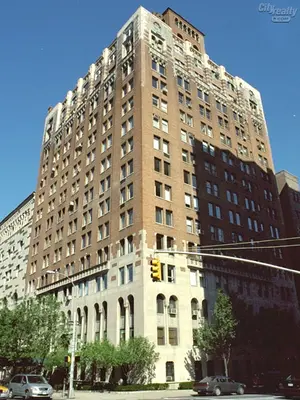
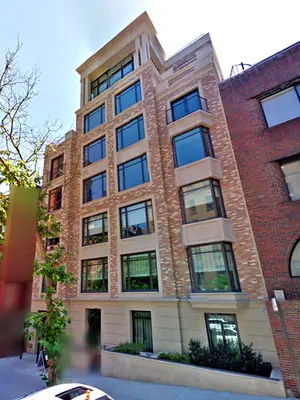
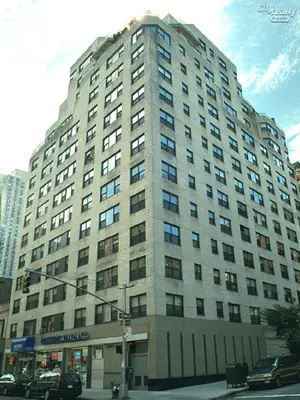
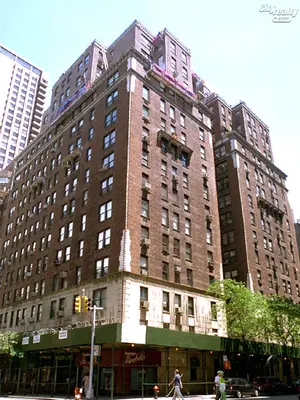
1158 Fifth Avenue is a landmarked prewar building completed in 1924 and incorporated in 1945. Designed by C. Howard Crane and Kenneth Franzheim in the French Renaissance-style, the building sits atop a 3-story limestone base and is clad in tan brick with wrought iron and limestone detailing. Its beautiful lobby features vaulted ceilings and ornate original details. Residents are serviced by a full-time staff of doormen and concierges as well as a live-in resident manager, and amenities include a fitness center, private storage, bicycle storage and central laundry.
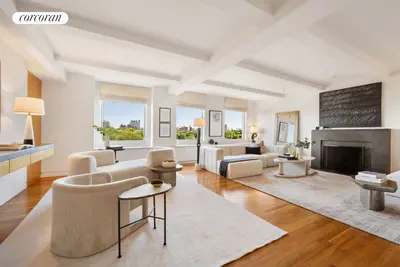
Located in prime Carnegie Hill and along Central Park, it is surrounded by the finest of the city's museums, a rich host of luxury and boutique shopping and dining and Manhattan's most preeminent schools. Financing is allowed up to 40%, and pets are permitted.
Interested in off-market listings at 1158 Fifth Avenue? Some previously listed residences might be available – contact us for insider details on potential opportunities!

View school info, local attractions, transportation options & more.
Experience amazing 3D aerial maps and fly throughs.
For some co-ops, instead of price per square foot, we use an estimate of the number of rooms for each sold apartment to chart price changes over time. This is because many co-op listings do not include square footage information, and this makes it challenging to calculate accurate square-foot averages.
By displaying the price per estimated room count, we are able to provide a more reliable and consistent metric for comparing sales in the building. While we hope that this gives you a clearer sense of price trends in the building, all data should be independently verified. All data provided are only estimates and should not be used to make any purchase or sale decision.
|
Year
Avg Price / Room (Est)
Avg. Actual Price
Med. Actual Price
Transactions
2025
-
-
0
2024
-
-
0
2023
-
-
0
2022
$655,921
$6,293,333
3
2021
$750,556
$4,983,333
3
2020
-
-
0
2019
$467,434
$4,112,500
2
2018
-
-
0
2017
$538,095
$3,766,667
3
2016
$444,048
$2,825,000
2
2015
$677,513
$5,400,000
3
2014
-
-
0
|
Year
Avg Price / Room (Est)
Avg. Actual Price
Med. Actual Price
Transactions
2013
$467,857
$3,233,333
3
2012
$430,208
$3,068,750
4
2011
$371,429
$2,600,000
1
2010
$466,786
$3,836,250
4
2009
-
-
0
2008
$554,167
$3,325,000
2
2007
$476,974
$4,212,500
2
2006
$334,375
$1,787,500
3
2005
$391,722
$2,589,000
4
2004
$472,024
$3,013,250
4
2003
$221,429
$2,100,000
3
|
the following is a slider of images. For screen reader users, all slides are visible at all time so you may ignore control buttons.


Sign-up and we'll email you new listings in this building!
Whether you’re a buyer, investor, or simply curious, this report is your key to unlocking in-depth insights and analysis on .
Please confirm your details: