144 East 84th Street - Carnegie Hill
- Apartments
- Overview & Photos
- Maps
- Floorplans
- Sales Data & Comps
- Similar Buildings
- All Units

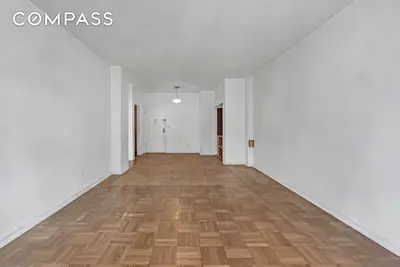

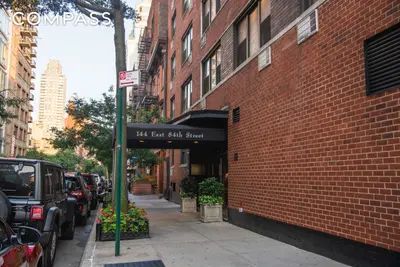
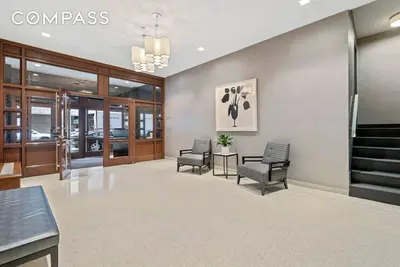
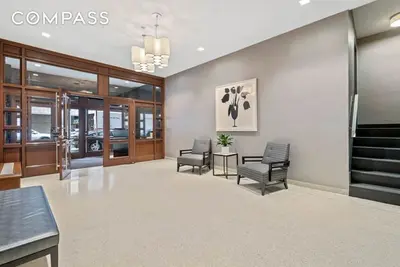

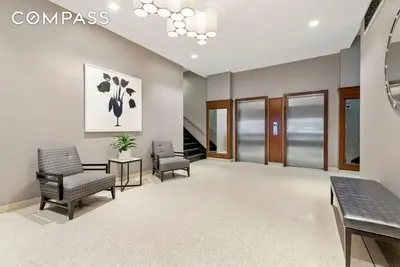
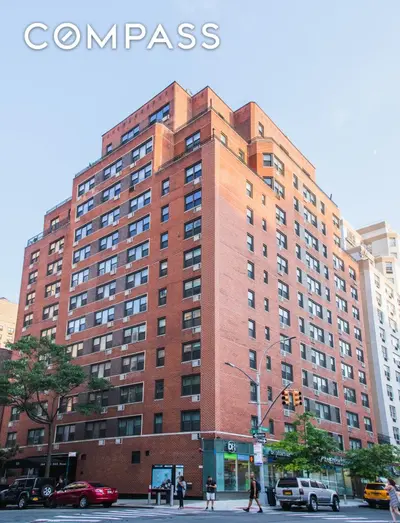

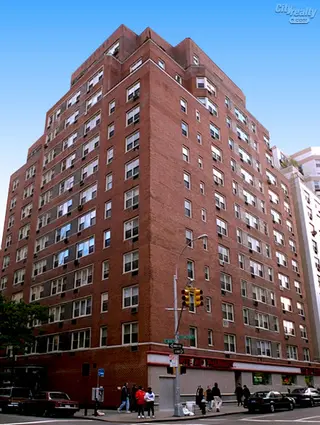
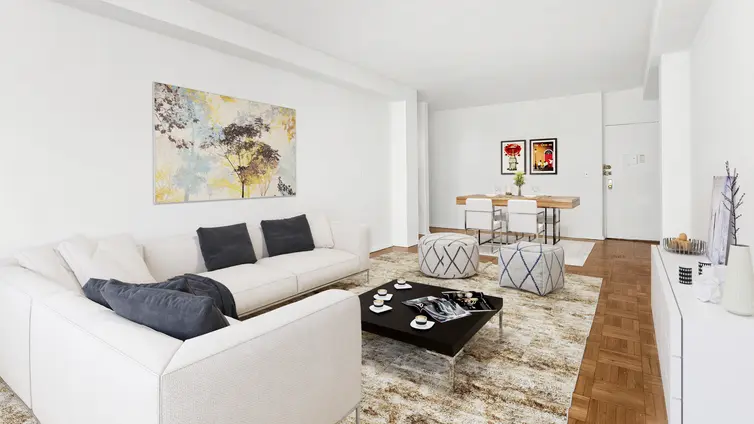
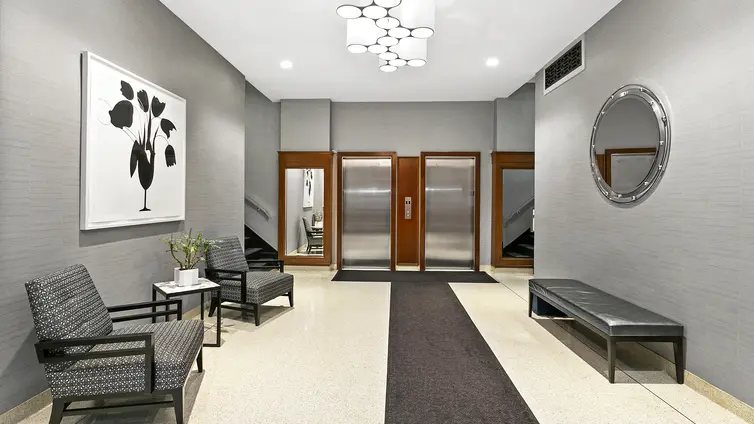
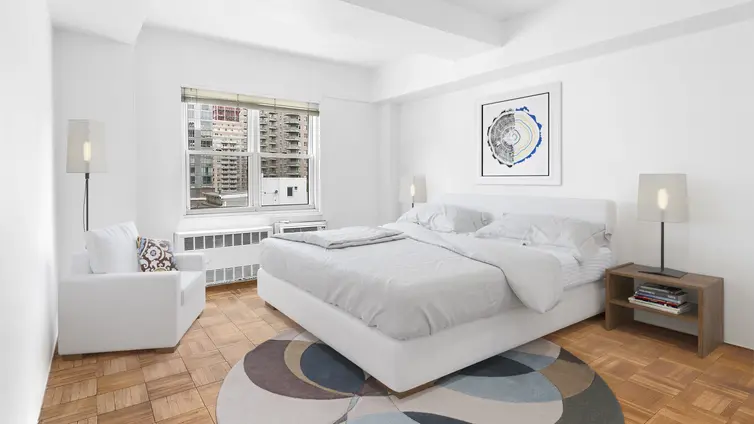
Built in 1963, 144 East 84th Street is a 15-story red brick co-op building housing 93 apartments on a prime Upper East Side corner at Lexington Avenue. The building features a canopied entrance with black marble surround and maintains the classic architectural character of its era, complete with consistent fenestration and some units offering private terraces or setback outdoor spaces.
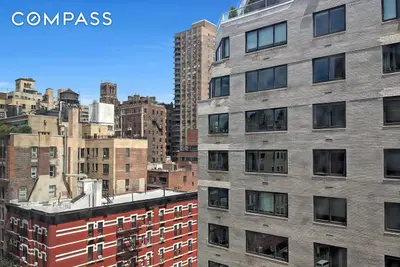
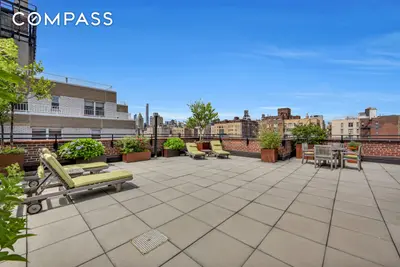
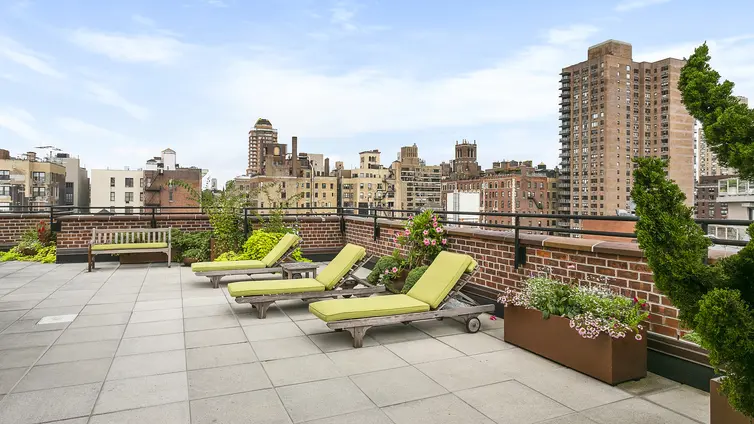
The building provides 24-hour doorman service along with a live-in superintendent, central laundry facilities, bike storage, and luggage room. A standout amenity is the beautifully planted rooftop terrace offering expansive city views, which serves as a communal outdoor retreat for residents. The building does not include a garage or health club, but compensates with attentive service and well-maintained common areas.
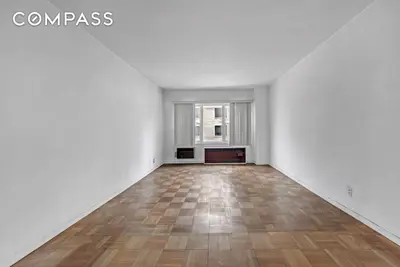
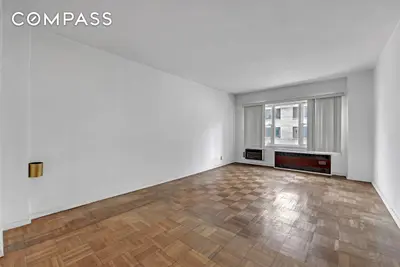
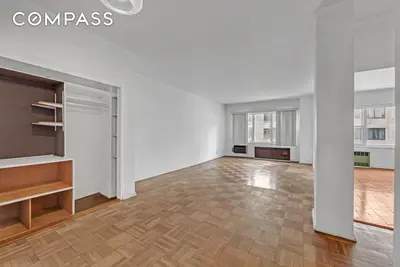
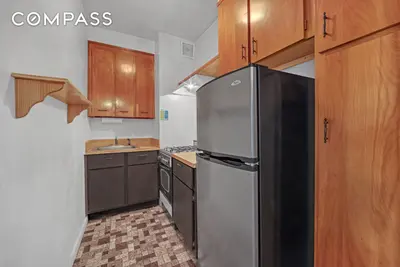
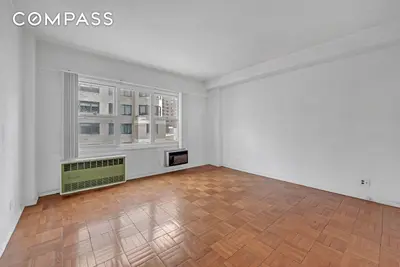
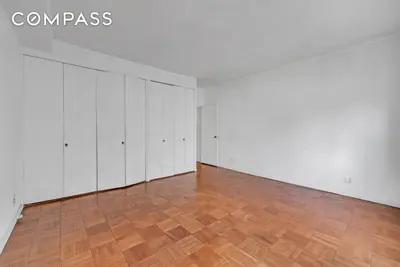
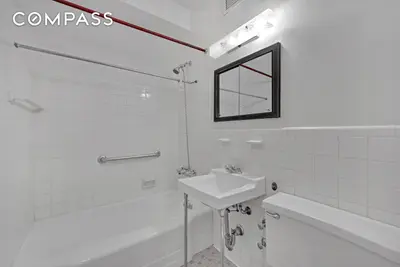
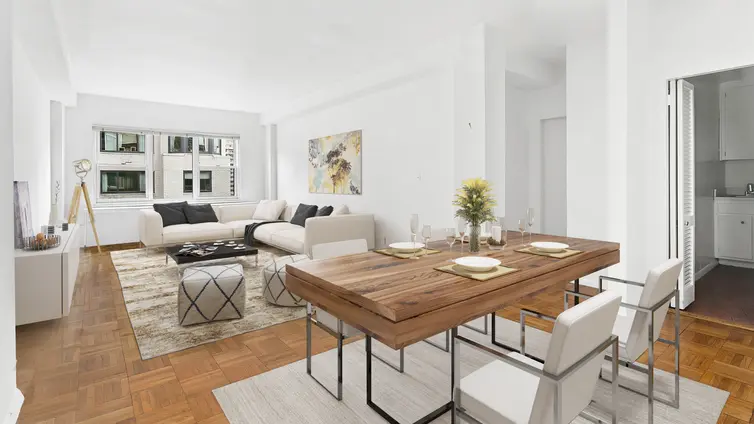
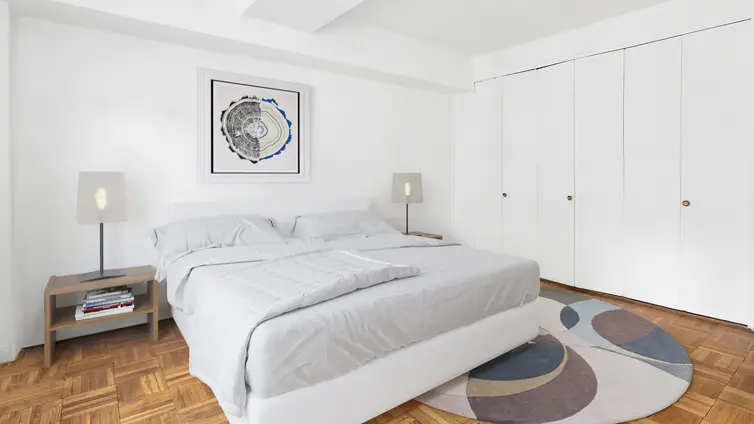
Apartments range from one-bedroom units starting around 850 square feet to spacious three-bedroom residences, with some featuring separate dining areas, home office spaces, and corner exposures. Many units have been recently renovated with modern kitchens featuring stainless steel appliances and granite countertops, updated bathrooms, and hardwood parquet flooring throughout. Select apartments include in-unit washer/dryer combinations and through wall air conditioning systems.
The building's financial strength is notable, with low maintenance fees that include gas, electricity, basic cable television, and internet service. This strong fiscal management has kept the building assessment free for many years while maintaining a substantial cash reserve. The co-op requires 30 percent down for purchases, permits pets, but discourages pied-à-terre arrangements, and notably charges no flip tax.
Location wise, residents enjoy proximity to multiple subway lines including the 4, 5, 6, and Q trains just two blocks away, plus convenient crosstown bus service on 86th Street. The building sits within three blocks of Central Park and the Museum Mile, surrounded by abundant shopping options including Target, Whole Foods, and numerous restaurants, making it an ideal base for Upper East Side living.

View school info, local attractions, transportation options & more.
Experience amazing 3D aerial maps and fly throughs.
For some co-ops, instead of price per square foot, we use an estimate of the number of rooms for each sold apartment to chart price changes over time. This is because many co-op listings do not include square footage information, and this makes it challenging to calculate accurate square-foot averages.
By displaying the price per estimated room count, we are able to provide a more reliable and consistent metric for comparing sales in the building. While we hope that this gives you a clearer sense of price trends in the building, all data should be independently verified. All data provided are only estimates and should not be used to make any purchase or sale decision.
Broker & Buyer Comments