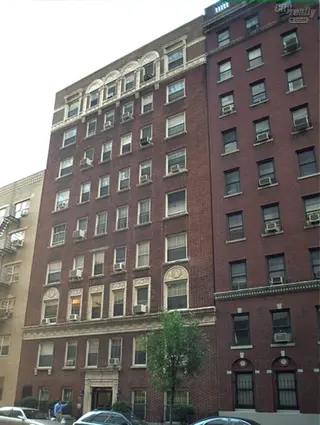
25 West 64th Street - Upper West Side
- Apartments
- Overview & Photos
- Maps
- Floorplans
- Sales Data & Comps
- Similar Buildings
- All Units
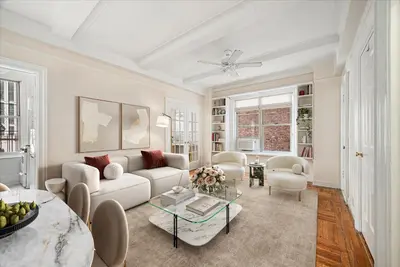
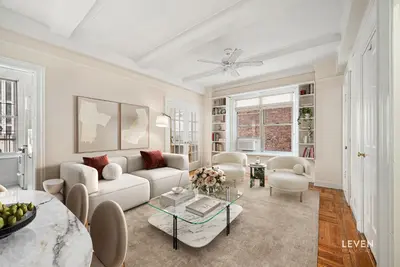
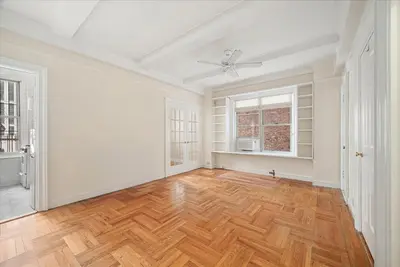
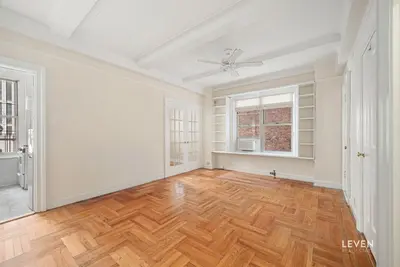
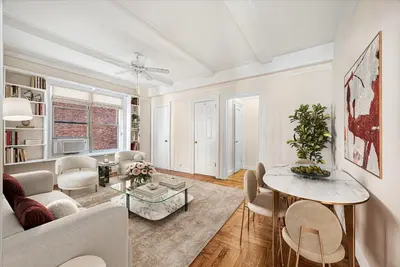

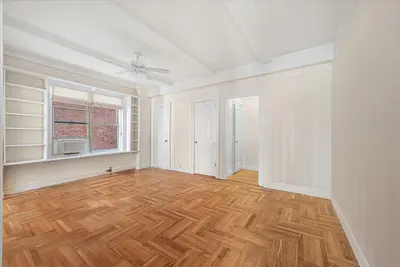

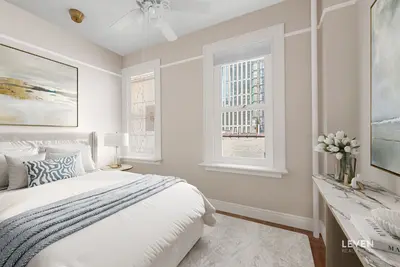
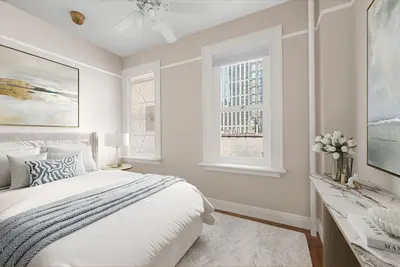
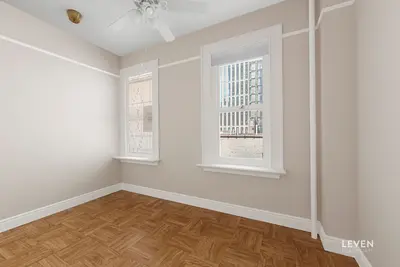
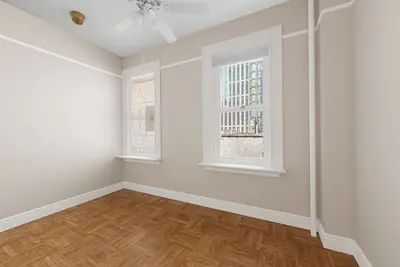

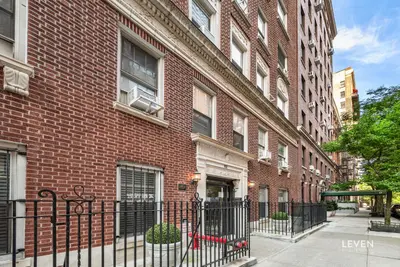
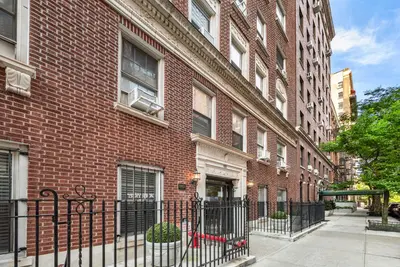
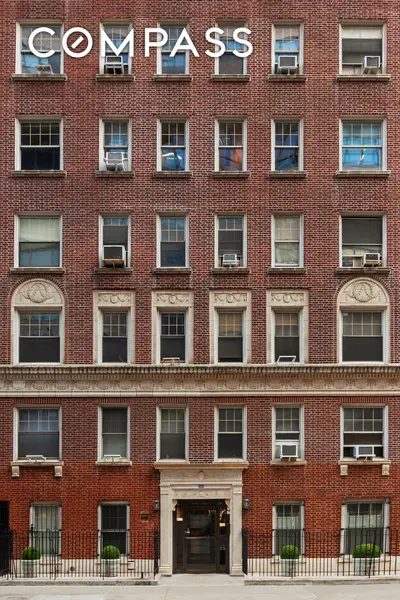


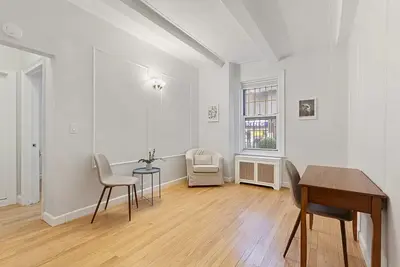
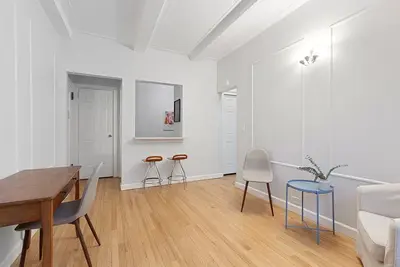
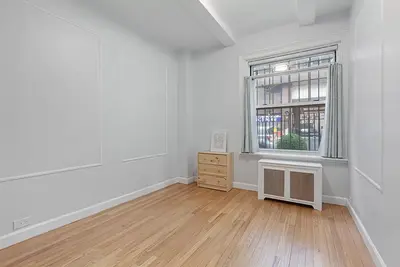

25 West 64th Street is a boutique Art Deco cooperative built in 1925, ideally situated between Central Park and Lincoln Center on the Upper West Side. The 52-unit pre-war building features a mix of studios and one-bedroom apartments, many of which retain classic pre-war details like beamed ceilings exceeding 9 feet in height and hardwood floors.
The building has been well-maintained with modern updates including a renovated lobby and common hallways. Residents enjoy amenities such as an elevator, on-site superintendent, laundry facilities, bicycle storage, and common storage space. The co-op allows pied-à-terre ownership and subletting with board approval after one year of ownership, though pets are not permitted.
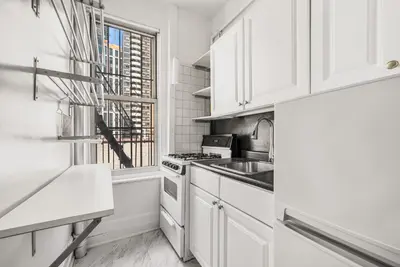
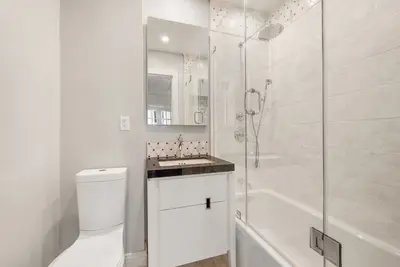
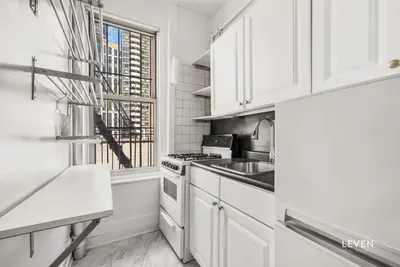
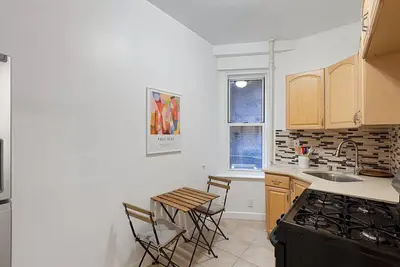
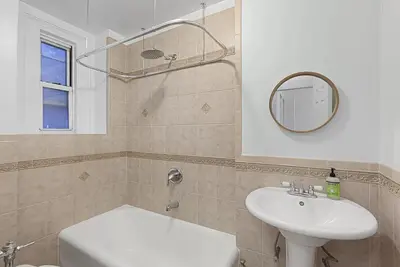
Its prime location offers immediate access to Central Park, Lincoln Center's cultural institutions, Columbus Circle's transportation hub, and the area's abundant dining and shopping options, including Whole Foods and the upcoming Wegmans. The building's apartments typically feature windowed kitchens and bathrooms, with many units having undergone contemporary renovations incorporating modern finishes and appliances.


View school info, local attractions, transportation options & more.
Experience amazing 3D aerial maps and fly throughs.
For some co-ops, instead of price per square foot, we use an estimate of the number of rooms for each sold apartment to chart price changes over time. This is because many co-op listings do not include square footage information, and this makes it challenging to calculate accurate square-foot averages.
By displaying the price per estimated room count, we are able to provide a more reliable and consistent metric for comparing sales in the building. While we hope that this gives you a clearer sense of price trends in the building, all data should be independently verified. All data provided are only estimates and should not be used to make any purchase or sale decision.