65 West 95th Street - Upper West Side
- Apartments
- Overview & Photos
- Maps
- Floorplans
- Sales Data & Comps
- Similar Buildings
- All Units


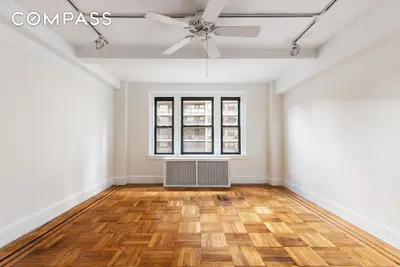
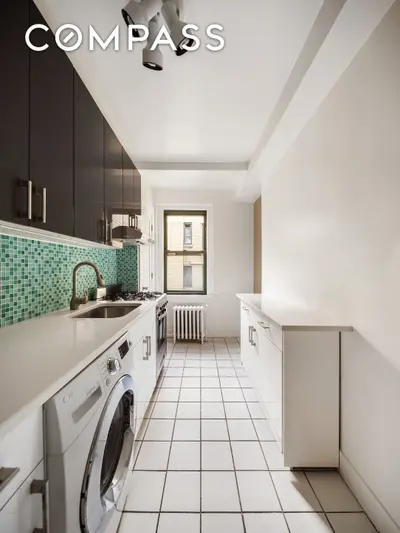
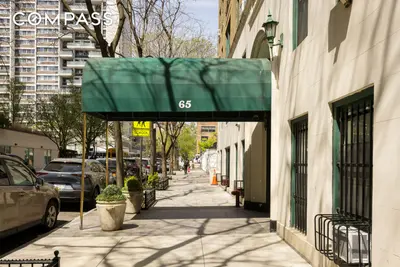
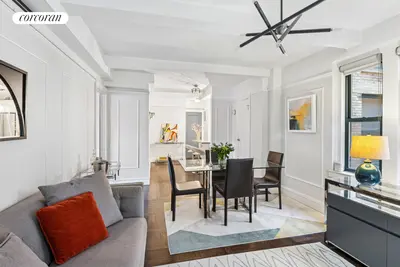
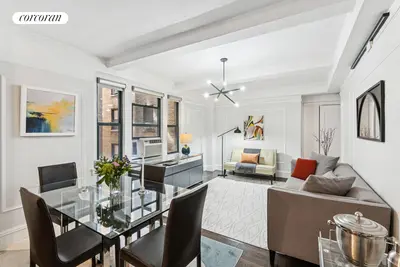
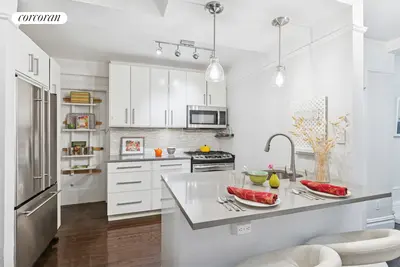
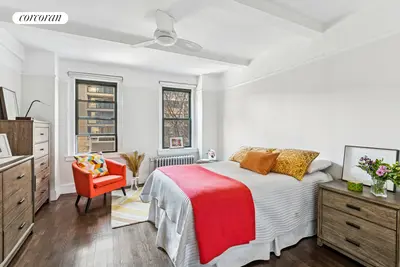

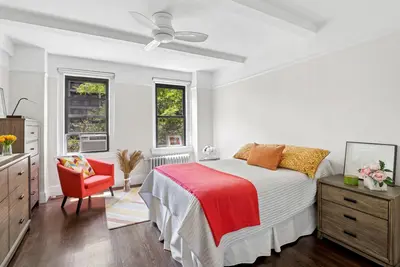
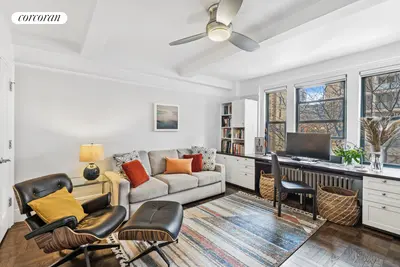

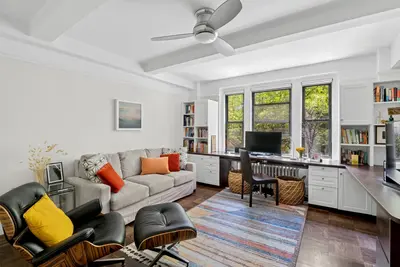

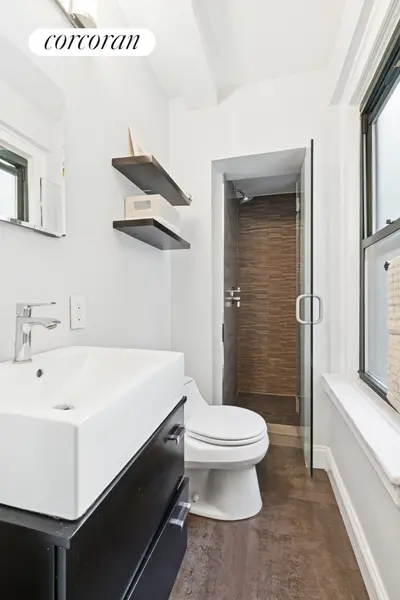
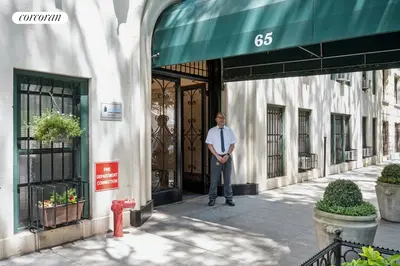


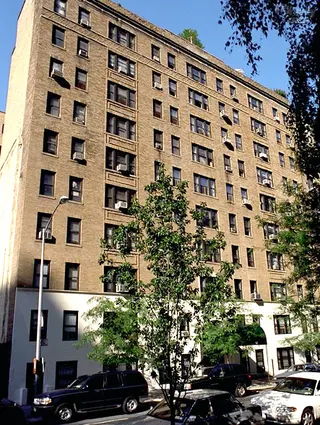
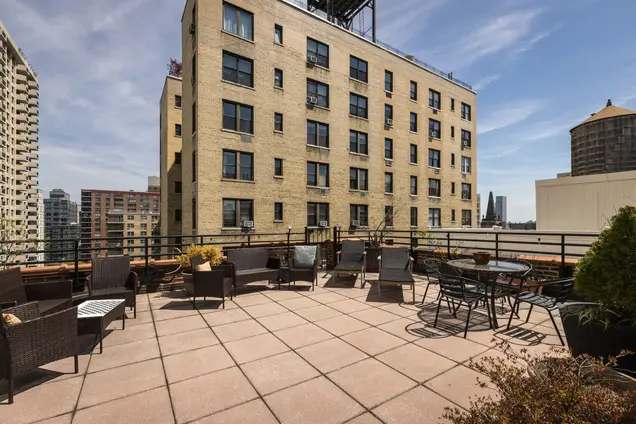
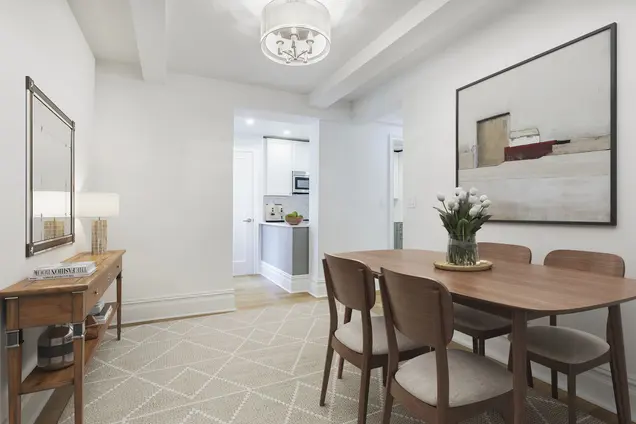
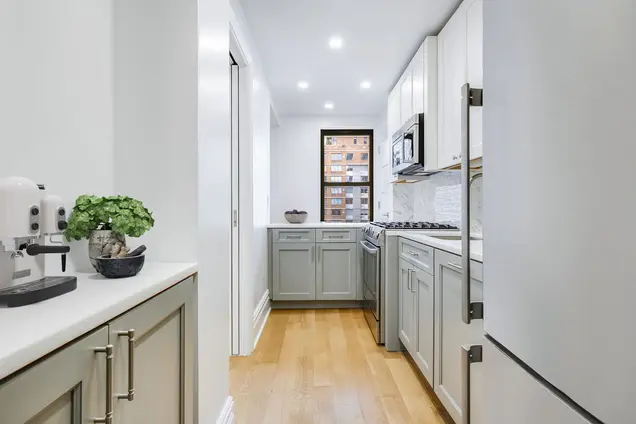
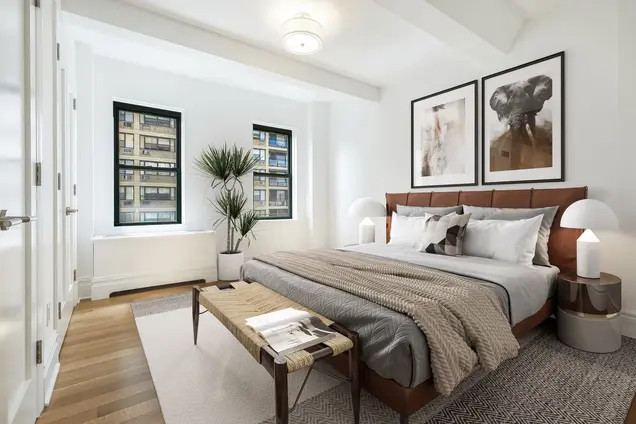
65 West 95th Street is an intimate pre-war co-op building in the Upper West Side's Central Park West neighborhood finished in 1928, measuring 12 stories and 70 units. It is a well-maintained building staffed by a 24/7 doorman as well as a live-in super and porters. Amenities also include a stunning roof deck, a large laundry room, bike sroom, and storage rooms. This pet-friendly coop permits pieds-a-terres an in-unit washer/dryers; immediate subletting is permitted with Board approval.
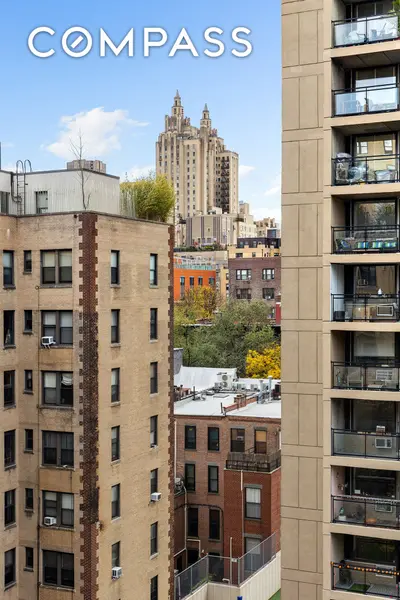
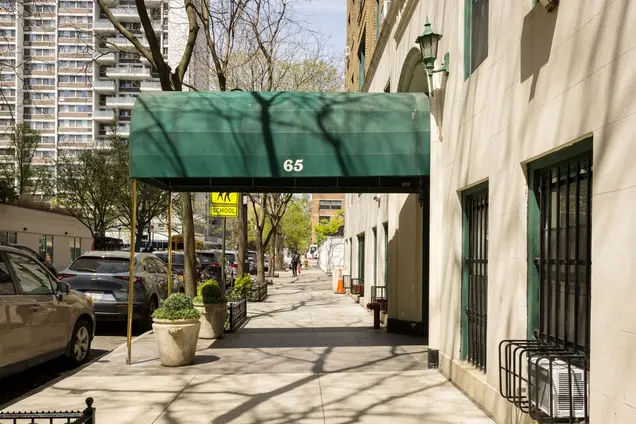
Situated between Central Park West and Columbus Avenue, the building is directly adjacent to Central Park and close to Trader Joe's, Whole Foods, numerous restaurants, and several transportation options.

View school info, local attractions, transportation options & more.
Experience amazing 3D aerial maps and fly throughs.
For some co-ops, instead of price per square foot, we use an estimate of the number of rooms for each sold apartment to chart price changes over time. This is because many co-op listings do not include square footage information, and this makes it challenging to calculate accurate square-foot averages.
By displaying the price per estimated room count, we are able to provide a more reliable and consistent metric for comparing sales in the building. While we hope that this gives you a clearer sense of price trends in the building, all data should be independently verified. All data provided are only estimates and should not be used to make any purchase or sale decision.


