7 West 96th Street - Upper West Side
- Apartments
- Overview & Photos
- Maps
- Floorplans
- Sales Data & Comps
- Similar Buildings
- All Units


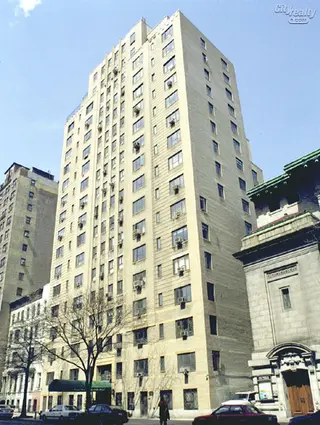
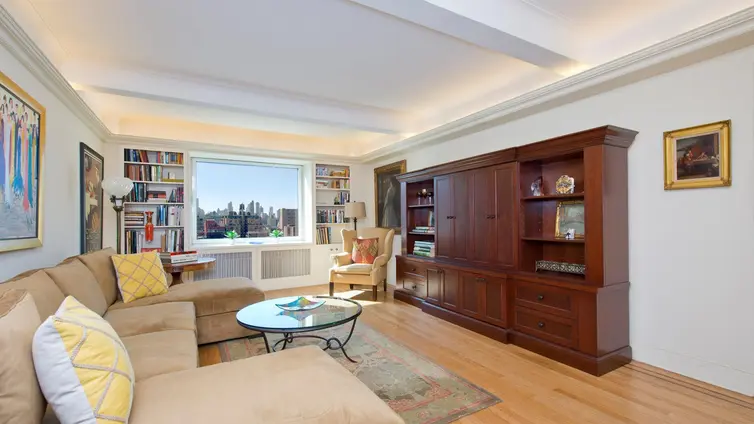
7 West 96th Street is an elegant Art Deco cooperative building designed by noted architect Thomas Lamb and completed in 1930. The 18-story structure houses 80 apartments and was converted to cooperative status in 1970. The building's distinguished architecture features a beige-brick façade with a granite base, excellent masonry work with banding details, projecting piers, and two subtle bay projections that add textural interest.
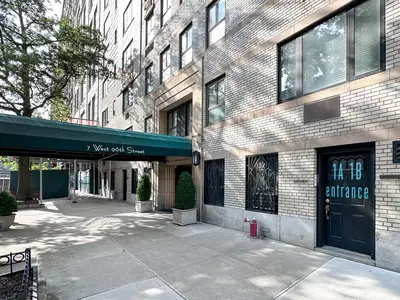
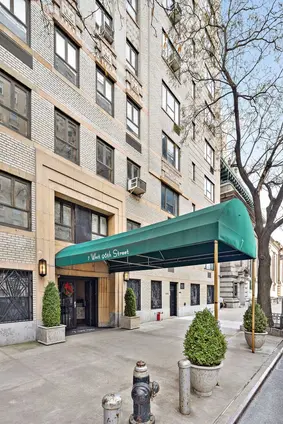
The building is particularly notable for its dramatic Art Deco lobby with an original fireplace, and its location just west of the impressive First Church of Christ Scientist on Central Park West. The full-service building offers 24-hour doorman service, a live-in superintendent, central laundry facilities, basement storage, bicycle storage, and a roof deck with panoramic views of Central Park and the Manhattan skyline.
Residents enjoy a prime Upper West Side location that combines the tranquility of being steps from Central Park with urban convenience. The surrounding neighborhood features an attractive mix of mid-rise and low-rise buildings, with proximity to Park West Village and the West Side Urban Renewal Area's handsome towers along Columbus Avenue.
The cooperative allows pets and in-unit washer/dryers with board approval, and permits up to 75% financing. Pied-à-terres are not permitted. The building maintains strong financials under excellent management.
Transportation options are abundant, with the B/C subway lines at Central Park West, the 1/2/3 trains three blocks west, and cross-town bus service at the doorstep. The location offers easy access to numerous amenities, including Whole Foods and Trader Joe's.
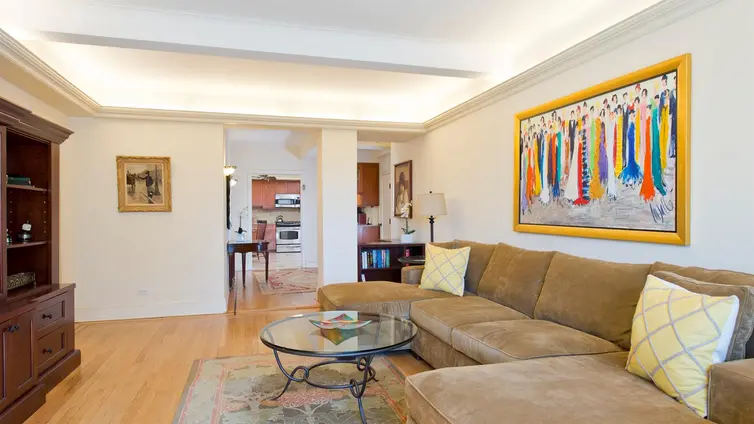
While the building lacks certain amenities like a garage or health club, it compensates with its prewar charm, solid construction, and prime location that exemplifies classic Upper West Side living.


View school info, local attractions, transportation options & more.
Experience amazing 3D aerial maps and fly throughs.
For some co-ops, instead of price per square foot, we use an estimate of the number of rooms for each sold apartment to chart price changes over time. This is because many co-op listings do not include square footage information, and this makes it challenging to calculate accurate square-foot averages.
By displaying the price per estimated room count, we are able to provide a more reliable and consistent metric for comparing sales in the building. While we hope that this gives you a clearer sense of price trends in the building, all data should be independently verified. All data provided are only estimates and should not be used to make any purchase or sale decision.