Shh... Many units sell without being publicly listed.
Discover hidden opportunities at The Bancroft! Reach out today to learn about select off-market listings.
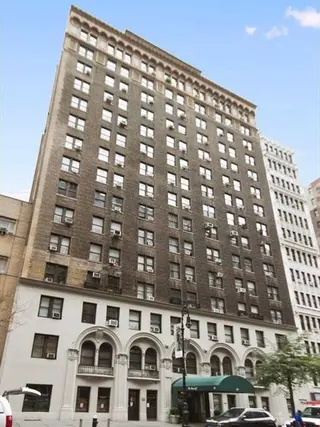
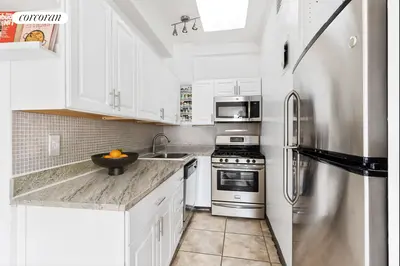
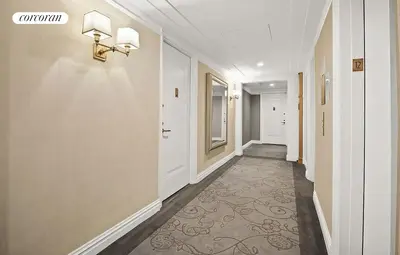
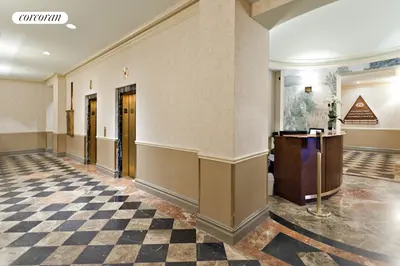
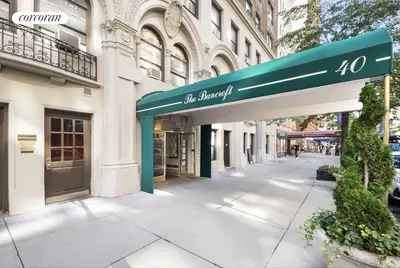
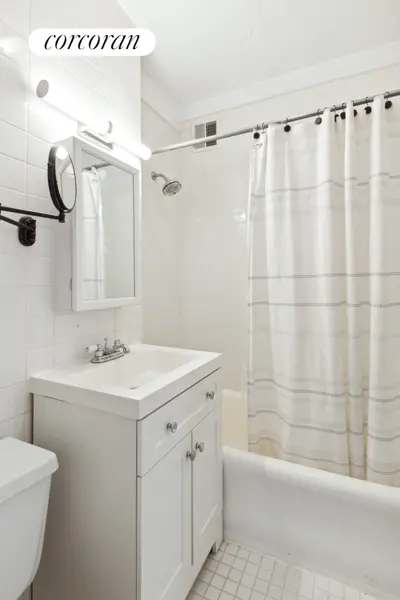
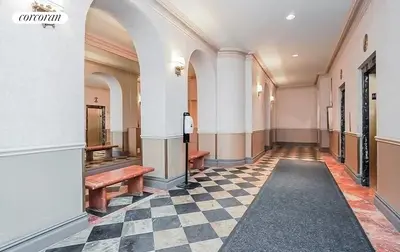
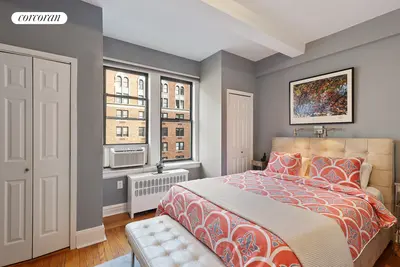
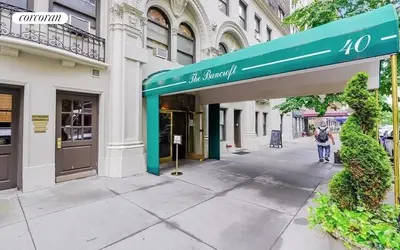
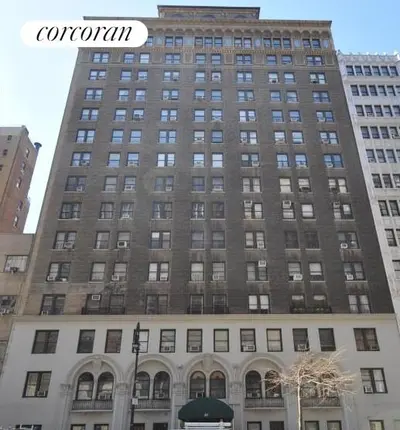
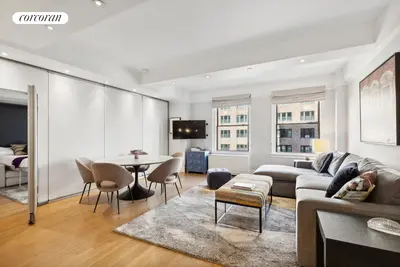

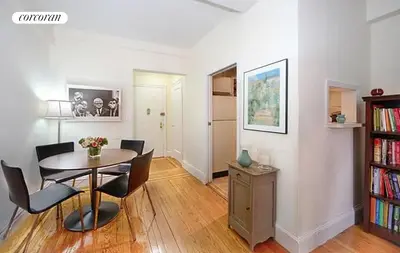
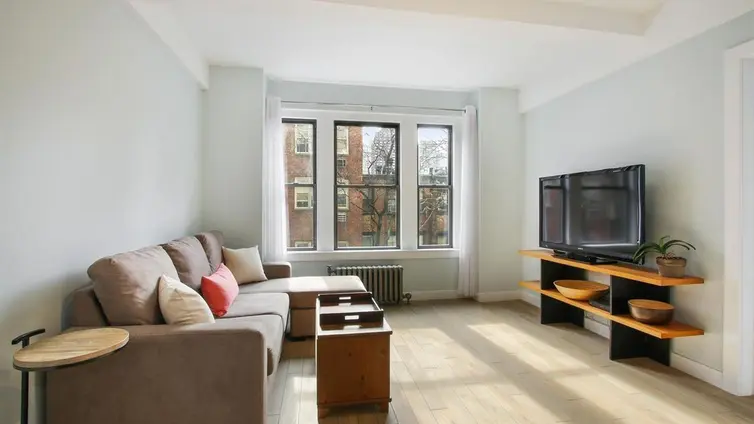
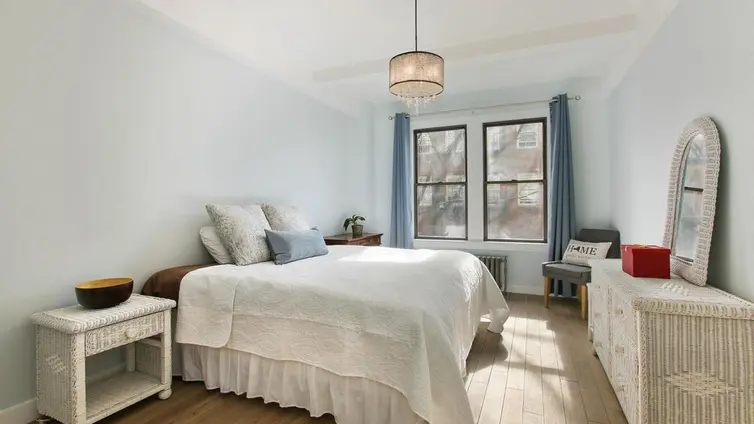
The Bancroft is an Italian Renaissance palazzo-style prewar building built in 1926 and converted to a full-service coop in 1984 with 15 floors and 142 apartments. The building features a full-time doorman and offers storage space ($300 annually), a bike room, and a laundry room. Pets, pieds-a-terre, guarantors, and co-purchasing are permitted.
The Bancroft is located at 40 West 72nd Street near Central Park, top-rated restaurants, cool coffee shops, chic shopping, and gourmet supermarkets like Trader Joe's, Citarella, and Fairway. Nearby public transportation includes the B/C and 1/2/3 trains and crosstown buses going in all directions.
Discover hidden opportunities at The Bancroft! Reach out today to learn about select off-market listings.

View school info, local attractions, transportation options & more.
Experience amazing 3D aerial maps and fly throughs.
For some co-ops, instead of price per square foot, we use an estimate of the number of rooms for each sold apartment to chart price changes over time. This is because many co-op listings do not include square footage information, and this makes it challenging to calculate accurate square-foot averages.
By displaying the price per estimated room count, we are able to provide a more reliable and consistent metric for comparing sales in the building. While we hope that this gives you a clearer sense of price trends in the building, all data should be independently verified. All data provided are only estimates and should not be used to make any purchase or sale decision.
the following is a slider of images. For screen reader users, all slides are visible at all time so you may ignore control buttons.


Sign-up and we'll email you new listings in this building!
Whether you’re a buyer, investor, or simply curious, this report is your key to unlocking in-depth insights and analysis on .
Please confirm your details:

Broker & Buyer Comments