Shh... Many units sell without being publicly listed.
Limited off-market opportunities might be available at 261 West 22nd Street – ideal for those looking to explore listings not currently on the market. Contact us to learn more.
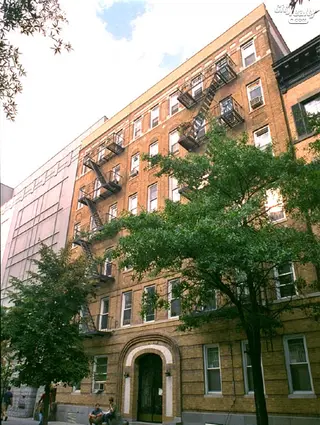
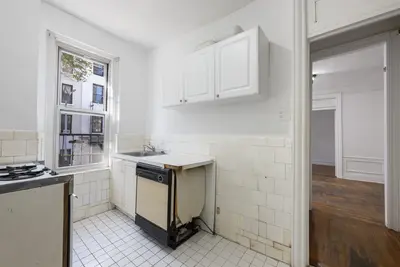
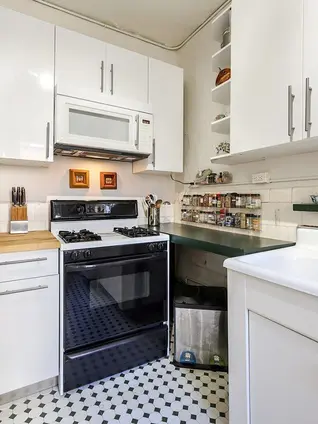
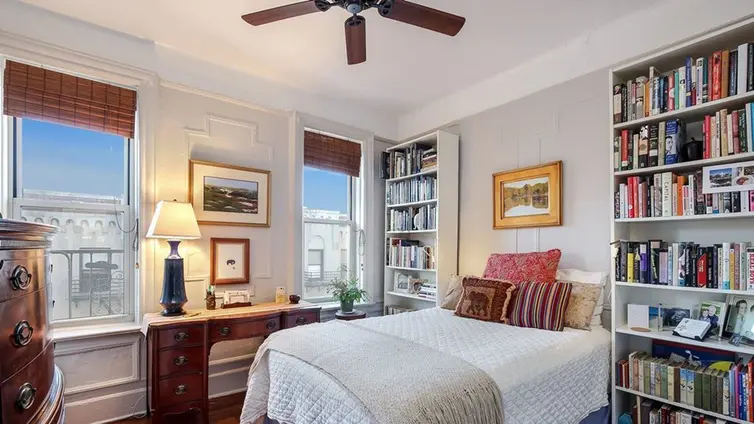
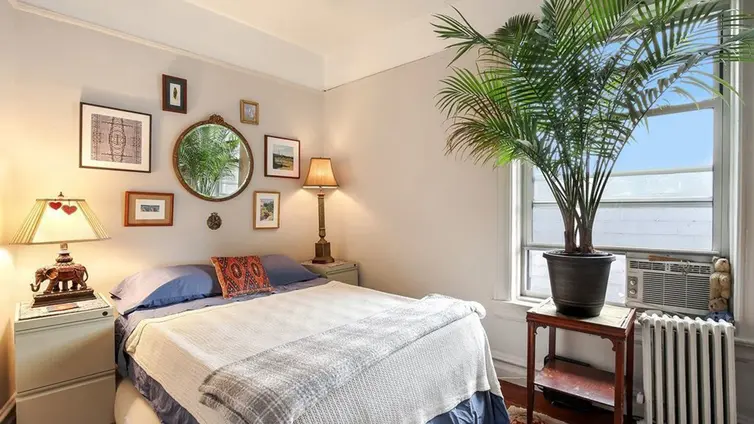
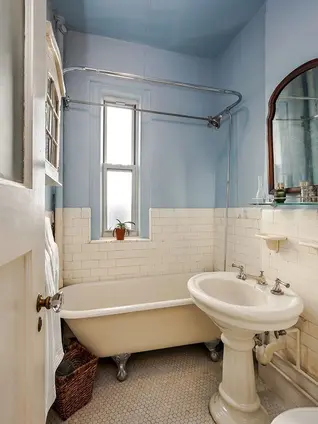
261 West 22nd Street is an immaculate prewar cooperative completed in 1917 and located on a prime Chelsea block near the High Line, world-famous galleries, top restaurants and shops, Chelsea Piers, Hudson Yards, and all modes of transportation. Private storage units transfer with each purchase, and the building has a new roof deck. The building is pet-friendly and allows pied-a-terres, co-purchasing, and gifting.
Limited off-market opportunities might be available at 261 West 22nd Street – ideal for those looking to explore listings not currently on the market. Contact us to learn more.

View school info, local attractions, transportation options & more.
Experience amazing 3D aerial maps and fly throughs.
For some co-ops, instead of price per square foot, we use an estimate of the number of rooms for each sold apartment to chart price changes over time. This is because many co-op listings do not include square footage information, and this makes it challenging to calculate accurate square-foot averages.
By displaying the price per estimated room count, we are able to provide a more reliable and consistent metric for comparing sales in the building. While we hope that this gives you a clearer sense of price trends in the building, all data should be independently verified. All data provided are only estimates and should not be used to make any purchase or sale decision.
|
Year
Avg Price / Room (Est)
Avg. Actual Price
Med. Actual Price
Transactions
2025
$190,000
$760,000
2
2024
$226,667
$680,000
1
2023
$216,667
$650,000
1
2022
$205,000
$1,254,375
2
2021
$223,056
$823,333
3
2020
$177,500
$532,500
1
2019
$197,197
$672,855
5
2018
$100,000
$400,000
1
2017
$230,556
$851,667
3
2016
$216,375
$932,000
5
2015
$201,000
$485,450
2
2014
$191,042
$672,500
2
|
Year
Avg Price / Room (Est)
Avg. Actual Price
Med. Actual Price
Transactions
2013
$146,738
$440,213
2
2012
$150,625
$525,000
2
2011
$147,500
$590,000
2
2010
$156,667
$497,500
2
2009
$153,750
$615,000
1
2008
$180,000
$540,000
1
2007
$176,635
$612,375
4
2006
$171,400
$775,500
2
2005
$150,000
$450,000
1
2004
$112,956
$394,775
4
2003
$96,167
$288,500
2
|
the following is a slider of images. For screen reader users, all slides are visible at all time so you may ignore control buttons.
Sign-up and we'll email you new listings in this building!
Whether you’re a buyer, investor, or simply curious, this report is your key to unlocking in-depth insights and analysis on .
Please confirm your details: