The Chelsea Warren, 165 West 20th Street - Chelsea
- Apartments
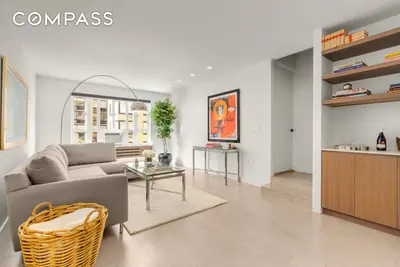
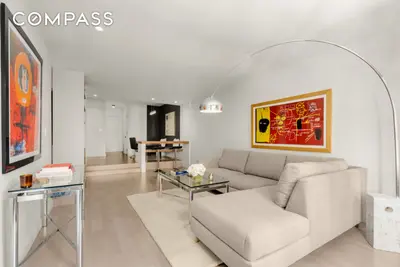
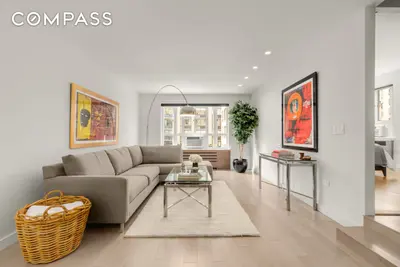
- Overview & Photos
- Maps
- Floorplans
- Sales Data & Comps
- Similar Buildings
- All Units
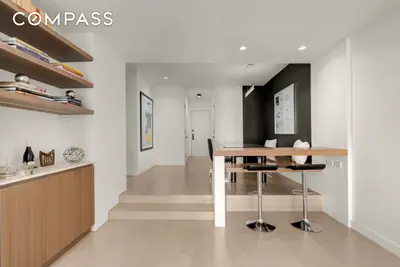
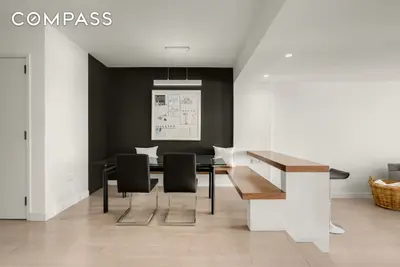
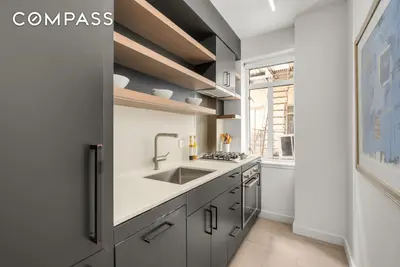
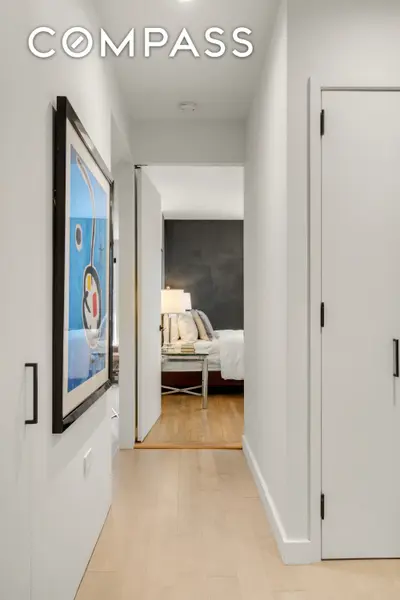
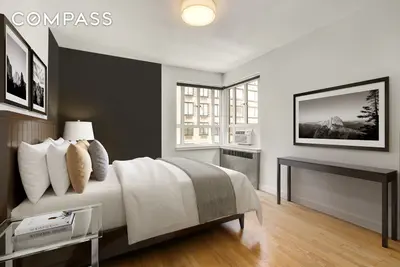
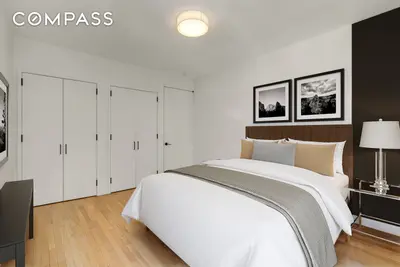
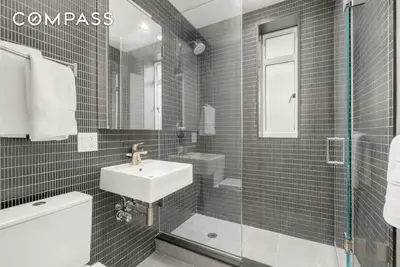
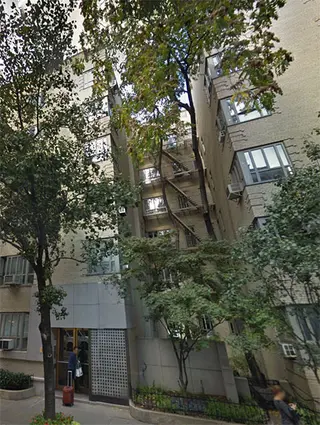
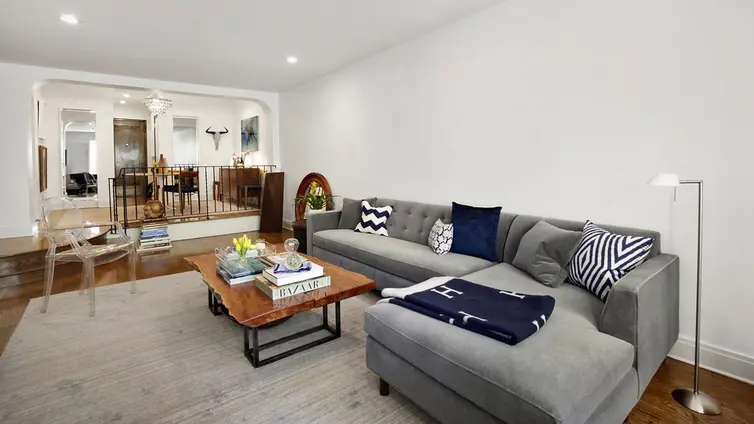
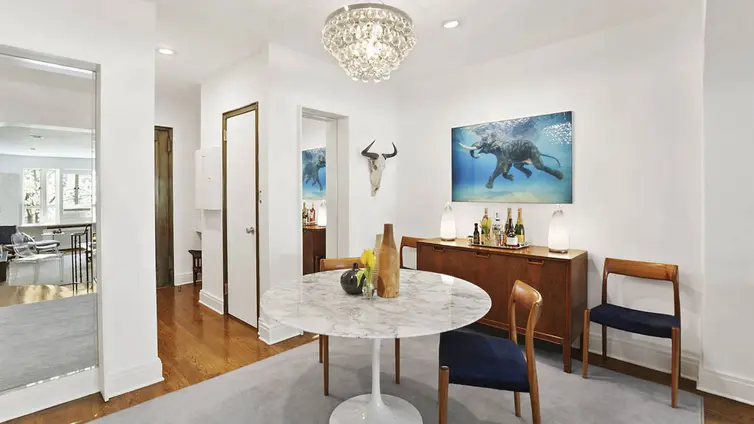
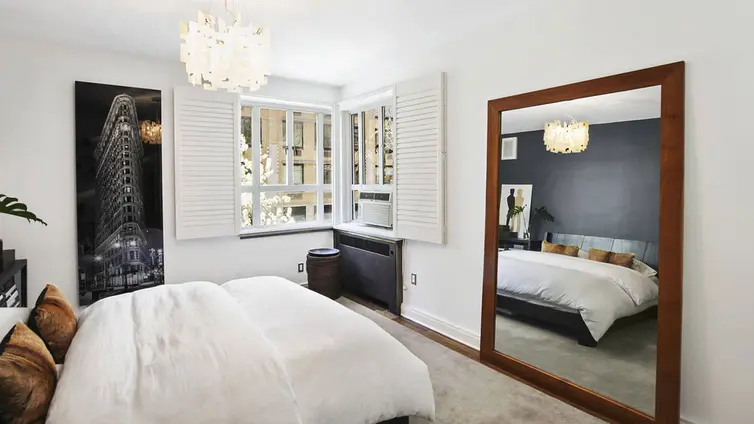
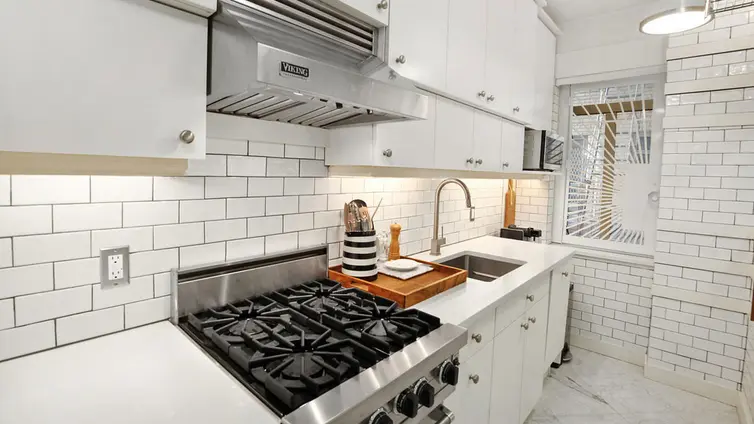
The Chelsea Warren is a six-story, 58-unit cooperative that offers a renovated lobby with key fob access, newly renovated common areas and basement, a common laundry room, bike room, and storage. A live-in superintendent and a team of porters are on staff.
The Chelsea Warren is located at 165 West 20th Street near popular restaurants, gourmet markets, specialty shops, and historic townhouses and buildings. The High Line, NoMad, Union Square, the West Village, and the Meatpacking District are a short walk away.


View school info, local attractions, transportation options & more.
Experience amazing 3D aerial maps and fly throughs.
For some co-ops, instead of price per square foot, we use an estimate of the number of rooms for each sold apartment to chart price changes over time. This is because many co-op listings do not include square footage information, and this makes it challenging to calculate accurate square-foot averages.
By displaying the price per estimated room count, we are able to provide a more reliable and consistent metric for comparing sales in the building. While we hope that this gives you a clearer sense of price trends in the building, all data should be independently verified. All data provided are only estimates and should not be used to make any purchase or sale decision.