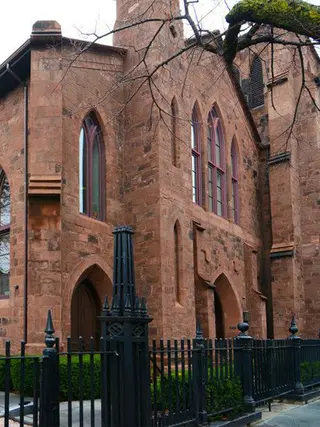
The Landmark at Strong Place, 58 Strong Place: Sales Summary
between Kane Street & Degraw Street Building Profile
All Sales
$1,476
Avg. Price / ft2
Past 12 months, based on 2 sales
$1,912,500
Avg. Price -
Past 12 months, based on 2 sales
$1,476
Median Price / ft2
Past 12 months, based on 2 sales
$1,912,500
Median Price
Past 12 months, based on 2 sales
Year
Avg Price / Ft2
Median Price / Ft2
Avg. Actual Price
Med. Actual Price
Transactions
2025
-
-
-
-
0
2024
$1,476
$1,912,500
$1,476
$1,912,500
2
2023
$1,524
$2,355,000
$1,426
$2,050,000
5
2022
$1,273
$2,495,000
$1,273
$2,495,000
1
2021
$1,269
$1,637,500
$1,269
$1,637,500
2
2020
$1,383
$1,605,500
$1,383
$1,605,500
2
2019
$987
$1,490,000
$987
$1,490,000
2
2018
$1,474
$1,400,000
$1,474
$1,400,000
1
2017
$1,359
$2,075,000
$1,233
$2,200,000
3
2016
-
-
-
-
0
2015
$1,188
$1,537,500
$1,188
$1,537,500
2
2014
-
-
-
-
0
2013
$1,098
$1,922,500
$1,098
$1,922,500
2
Year
Avg Price / Ft2
Median Price / Ft2
Avg. Actual Price
Med. Actual Price
Transactions
2012
$900
$1,300,521
$889
$1,060,000
10
2011
$974
$1,445,441
$942
$1,406,250
12
2010
-
-
-
-
0
2009
-
-
-
-
0
2008
-
-
-
-
0
2007
-
-
-
-
0
2006
-
-
-
-
0
2005
-
-
-
-
0
2004
-
-
-
-
0
2003
-
-
-
-
0
The Breakdown of All Sales by Apartment Size