111 Third Avenue - East Village
- Apartments
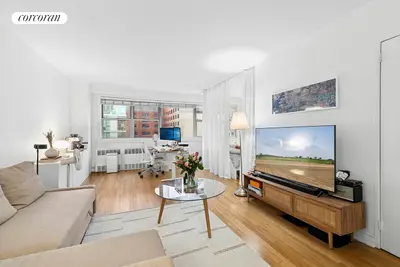
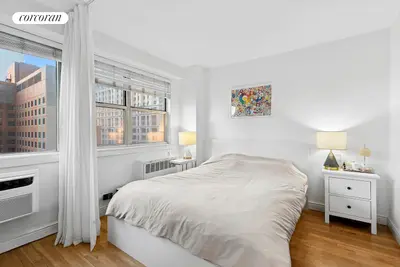
- Overview & Photos
- Maps
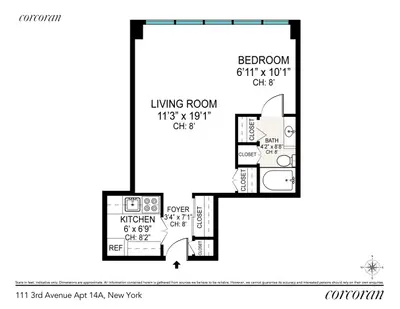
- Floorplans
- Sales Data & Comps
- Similar Buildings
- All Units
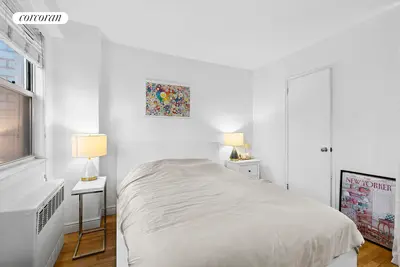
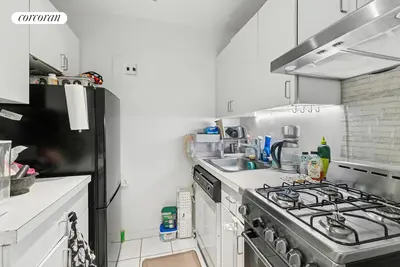
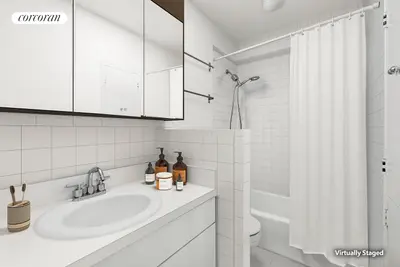
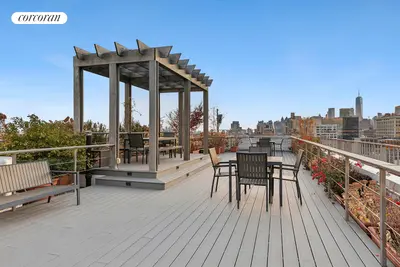


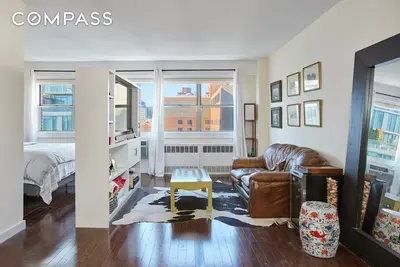

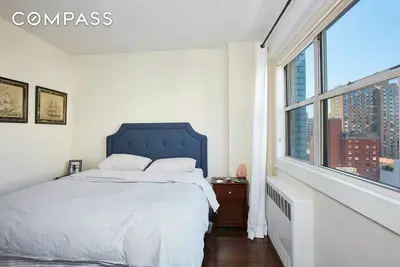

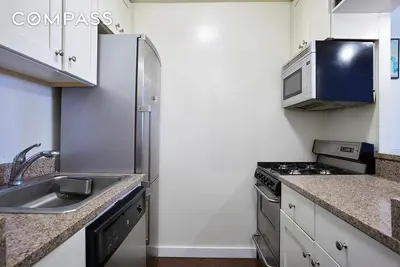

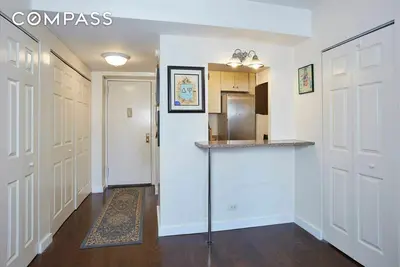

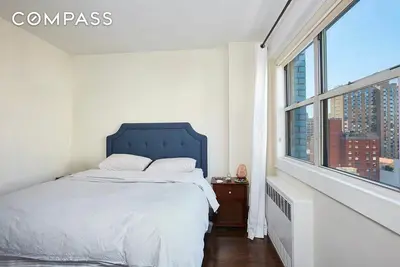

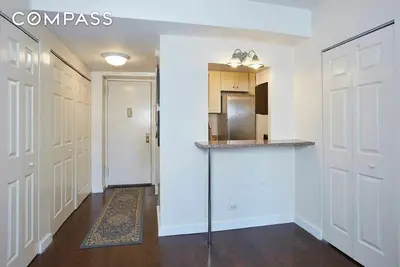


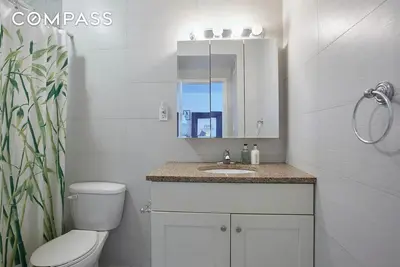

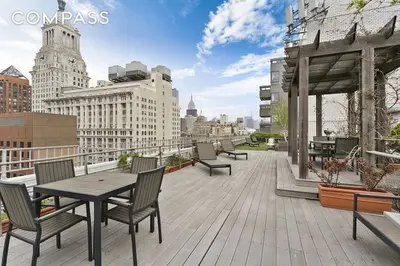
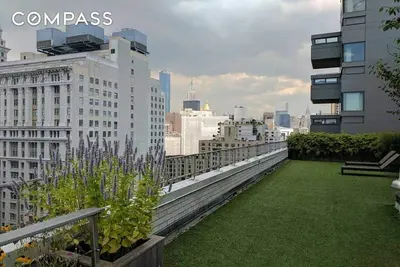


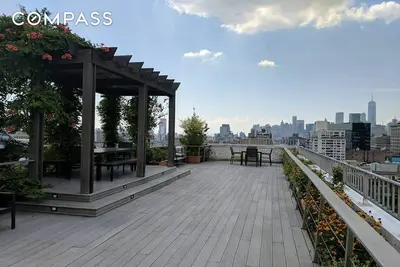
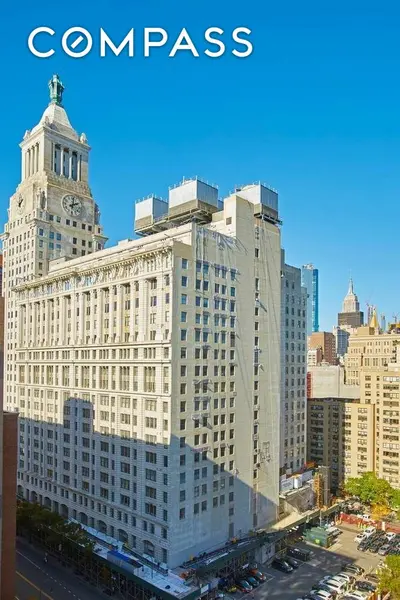


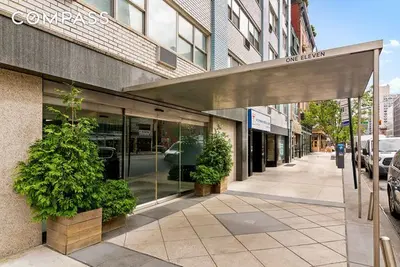
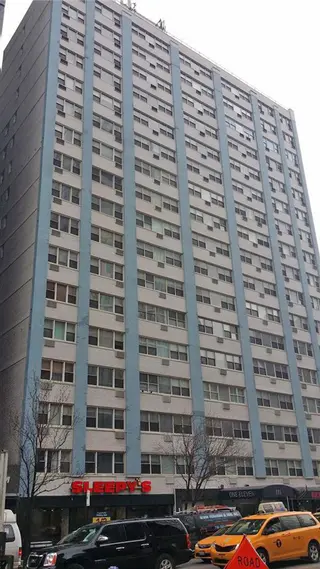
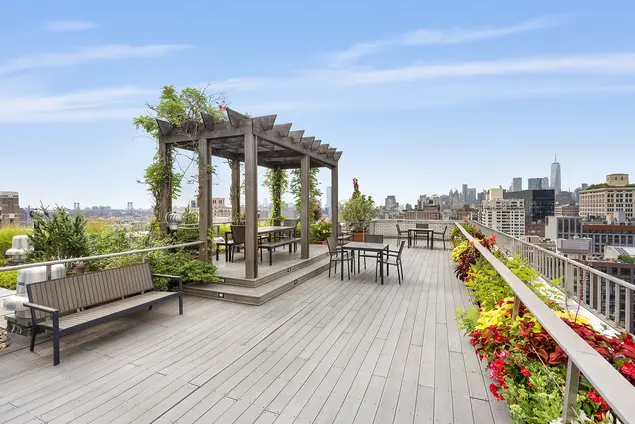
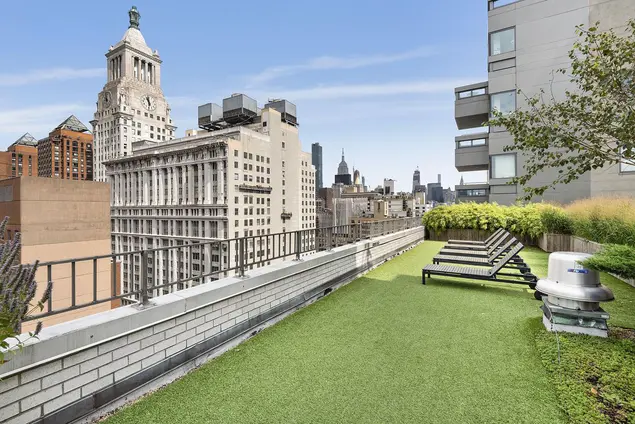
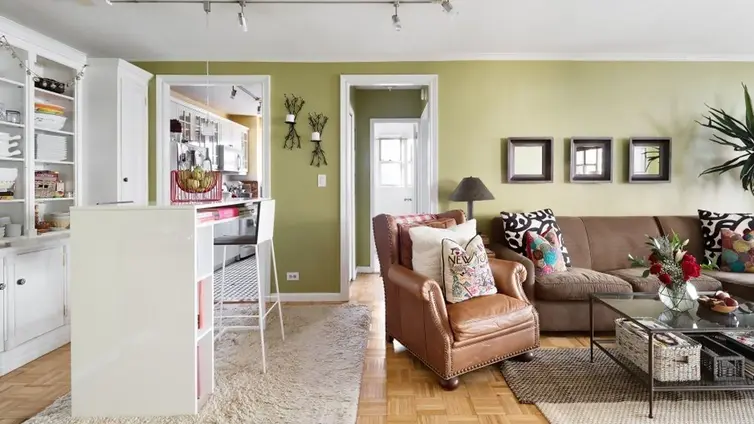
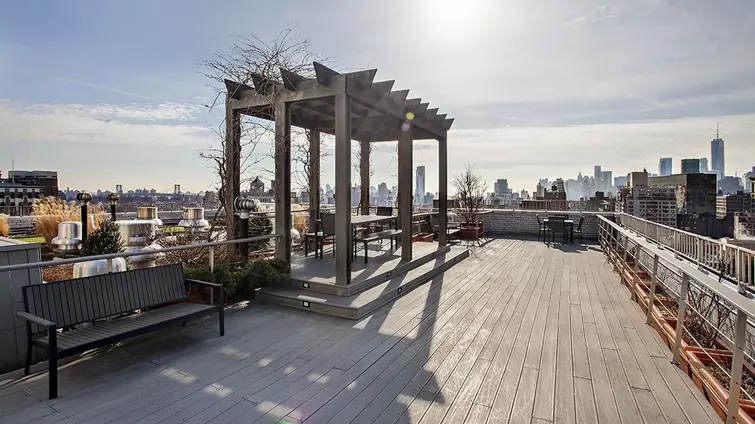
111 Third Avenue is a full-service cooperative in the East Village, between East 13th and East 14th Streets. The staff includes 24-hour doorman, concierge, live-in superintendent, and full-time porters. Amenities include a basement laundry room, bike storage, and a furnished roof deck and landscaped sun terrace.
Union Square Park, Trader Joe's, Whole Foods, popular local restaurants and retail, and the Union Square transportation hub are a short walk from the building. Pets are welcome.

View school info, local attractions, transportation options & more.
Experience amazing 3D aerial maps and fly throughs.
For some co-ops, instead of price per square foot, we use an estimate of the number of rooms for each sold apartment to chart price changes over time. This is because many co-op listings do not include square footage information, and this makes it challenging to calculate accurate square-foot averages.
By displaying the price per estimated room count, we are able to provide a more reliable and consistent metric for comparing sales in the building. While we hope that this gives you a clearer sense of price trends in the building, all data should be independently verified. All data provided are only estimates and should not be used to make any purchase or sale decision.