Shh... Many units sell without being publicly listed.
Limited off-market opportunities might be available at 176 Broadway – ideal for those looking to explore listings not currently on the market. Contact us to learn more.
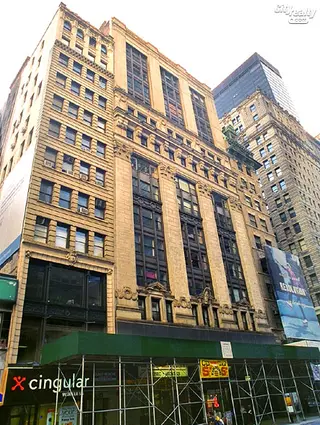

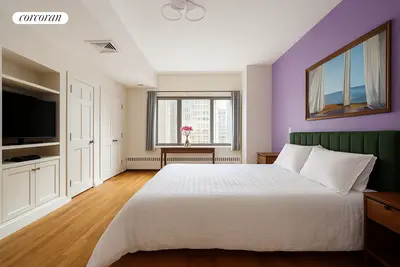
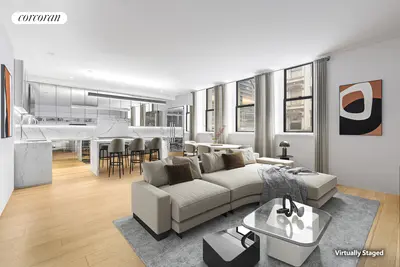
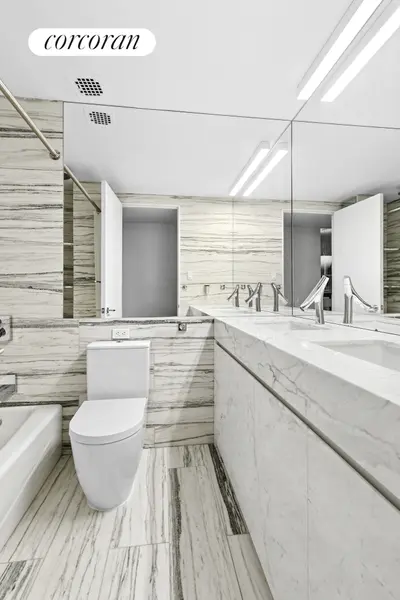
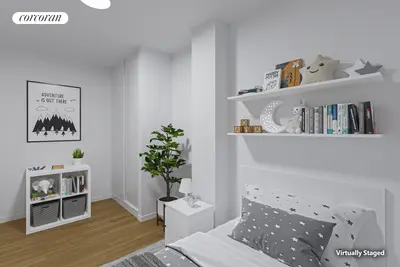
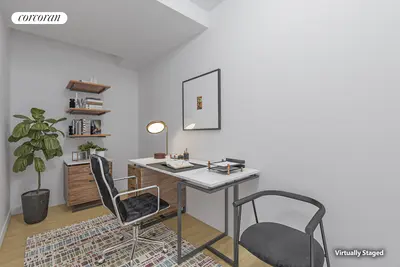
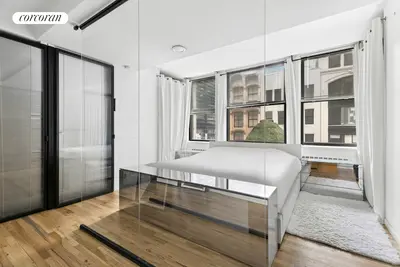
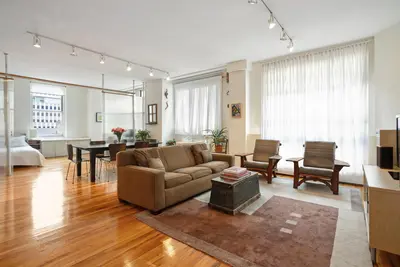
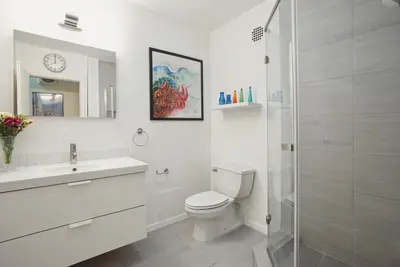
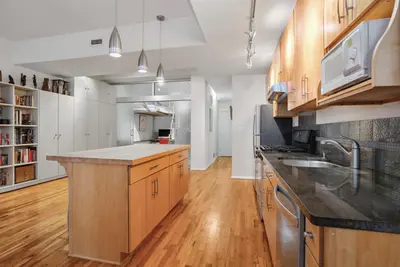
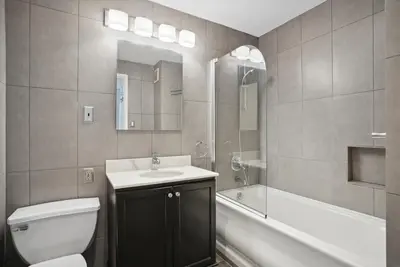
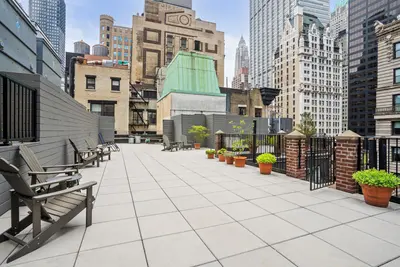
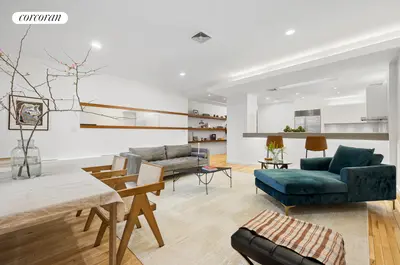
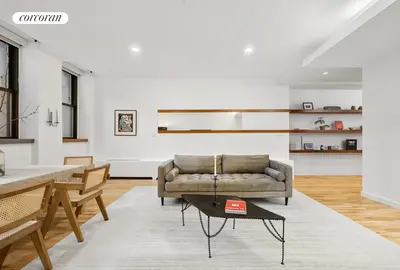
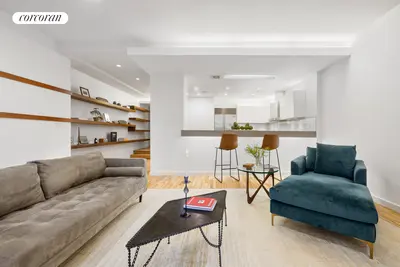
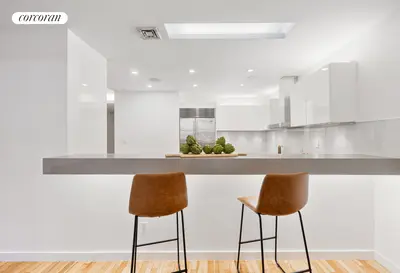
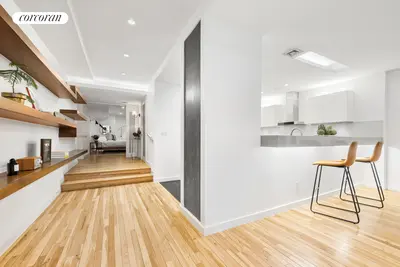
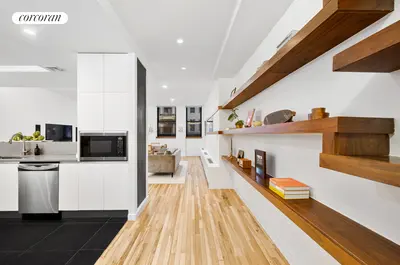
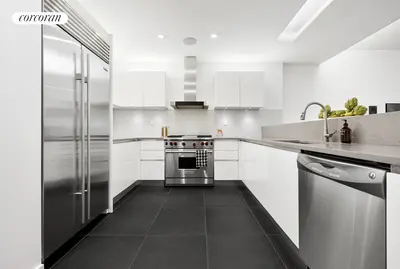
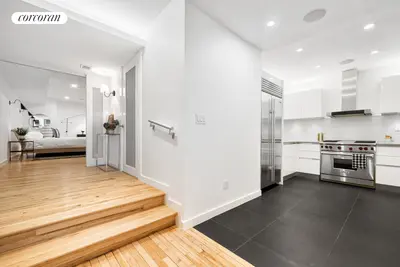
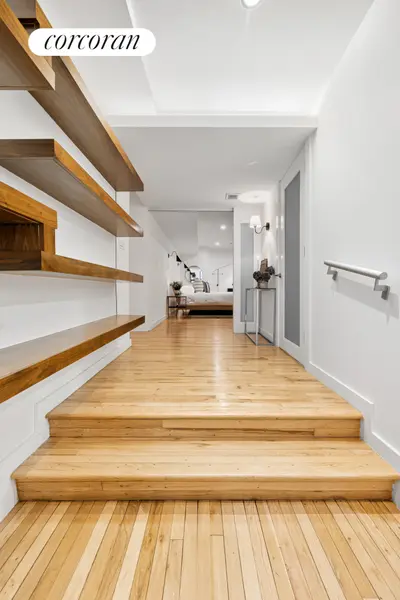
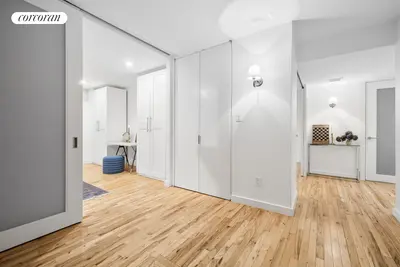
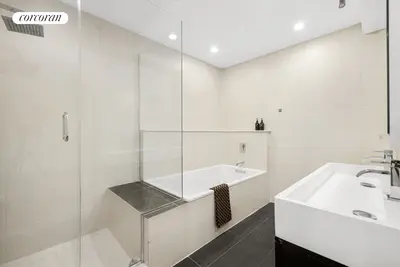
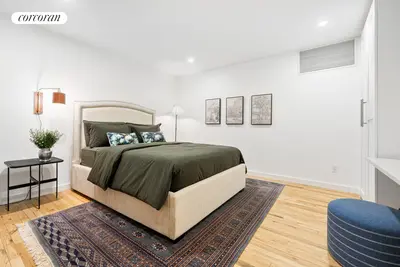
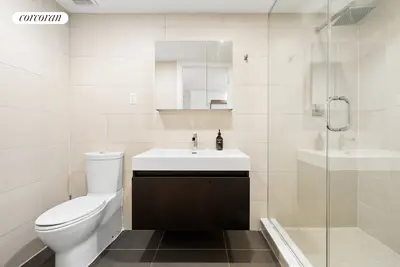
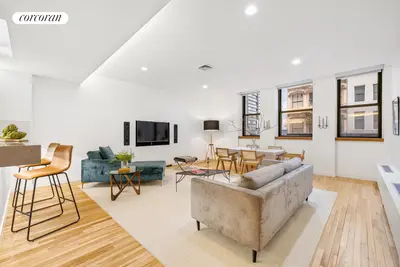
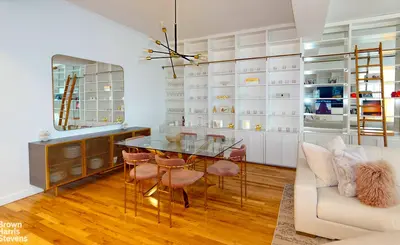
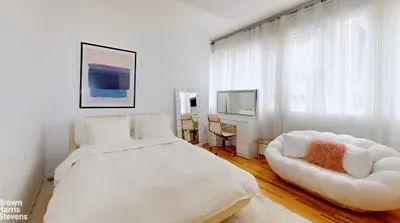


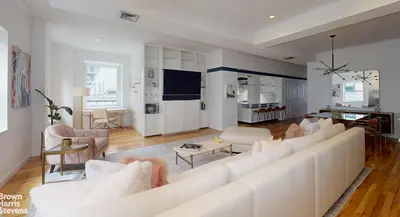
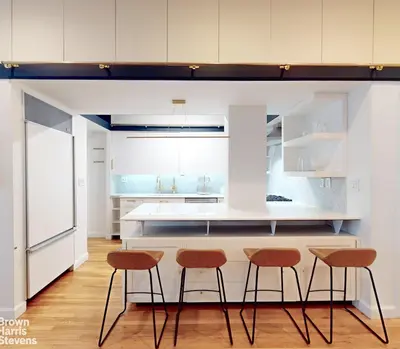
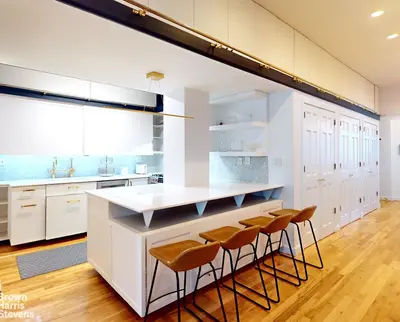
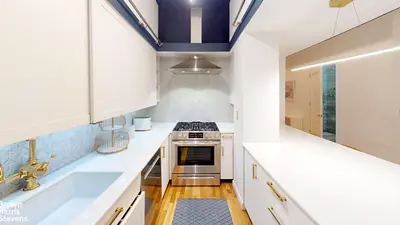
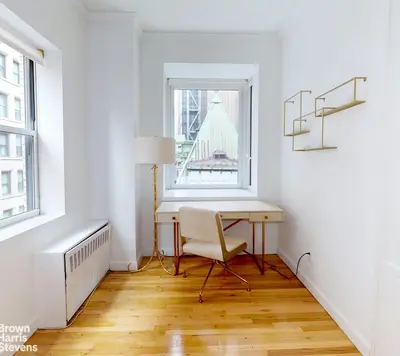
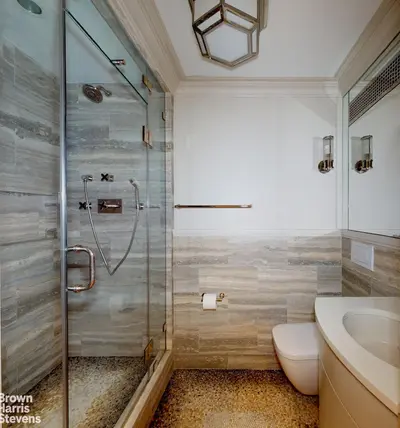

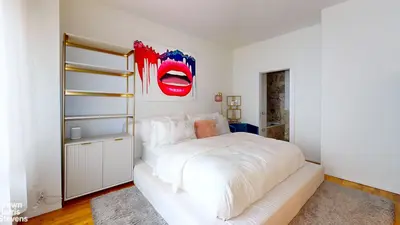
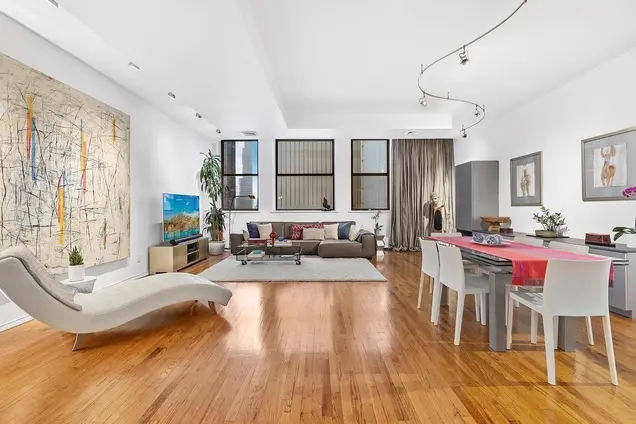
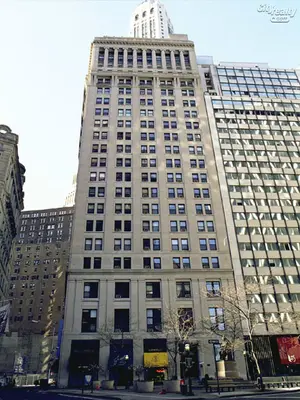
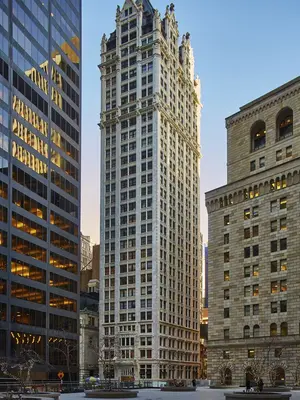
176 Broadway is a pre-war co-op building in Manhattan's Financial District neighborhood finished in 1905. Situated between John Street and Maiden Lane, the building contains 72 units and rises 14 stories. A part-time doorman is on staff, and amenities include a common roof deck and laundry on every floor. The building allows pets and co-purchasing, and is a short walk from Nobu, Manhatta, Whole Foods, Eataly, the Oculus, and Brookfield Place.
Limited off-market opportunities might be available at 176 Broadway – ideal for those looking to explore listings not currently on the market. Contact us to learn more.
View school info, local attractions, transportation options & more.
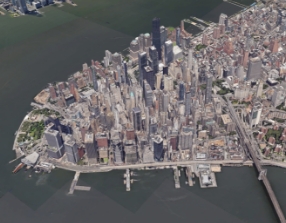
Experience amazing 3D aerial maps and fly throughs.
For some co-ops, instead of price per square foot, we use an estimate of the number of rooms for each sold apartment to chart price changes over time. This is because many co-op listings do not include square footage information, and this makes it challenging to calculate accurate square-foot averages.
By displaying the price per estimated room count, we are able to provide a more reliable and consistent metric for comparing sales in the building. While we hope that this gives you a clearer sense of price trends in the building, all data should be independently verified. All data provided are only estimates and should not be used to make any purchase or sale decision.
|
Year
Avg Price / Ft2 (Est)
Median Price / Ft2 (Est)
Avg. Actual Price
Med. Actual Price
Transactions
2025
$683
$2,050,000
$683
$2,050,000
1
2024
$810
$1,455,375
$883
$1,165,750
4
2023
$647
$800,000
$647
$800,000
2
2022
$856
$1,090,000
$856
$1,100,000
3
2021
$755
$1,103,750
$792
$1,097,500
4
2020
$937
$1,746,000
$916
$1,367,500
4
2019
-
$1,100,000
-
$1,100,000
1
2018
$905
$1,529,142
$933
$1,492,425
3
2017
$758
$1,108,333
$744
$1,185,000
3
2016
$956
$1,440,333
$1,016
$1,350,000
3
2015
$991
$1,848,500
$978
$1,635,000
5
2014
$751
$1,660,000
$751
$1,660,000
1
|
Year
Avg Price / Ft2 (Est)
Median Price / Ft2 (Est)
Avg. Actual Price
Med. Actual Price
Transactions
2013
$656
$1,135,000
$656
$1,135,000
2
2012
-
$1,481,500
$1,481,500
2
2011
$609
$852,500
$609
$850,000
3
2010
$541
$897,042
$541
$911,125
3
2009
$575
$690,000
$575
$690,000
1
2008
$637
$858,000
$704
$850,000
5
2007
$746
$1,076,667
$726
$1,047,500
6
2006
-
$1,235,000
$1,450,000
3
2005
$739
$1,043,625
$717
$929,750
4
2004
$557
$872,000
$491
$839,000
5
2003
$471
$794,333
$471
$703,000
3
Please note that price/ft2 calculations is from only 69% of total transactions during the period
|
the following is a slider of images. For screen reader users, all slides are visible at all time so you may ignore control buttons.
Sign-up and we'll email you new listings in this building!
Whether you’re a buyer, investor, or simply curious, this report is your key to unlocking in-depth insights and analysis on .
Please confirm your details:


Broker & Buyer Comments