Shh... Many units sell without being publicly listed.
Interested in off-market listings at 1818 Newkirk Avenue? Some previously listed residences might be available – contact us for insider details on potential opportunities!

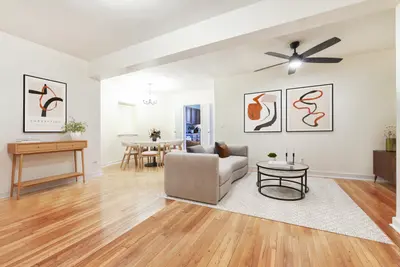
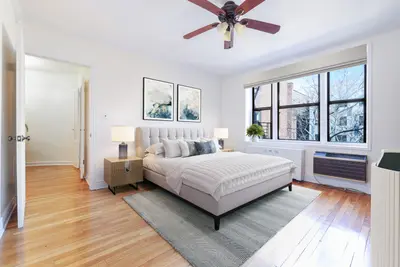
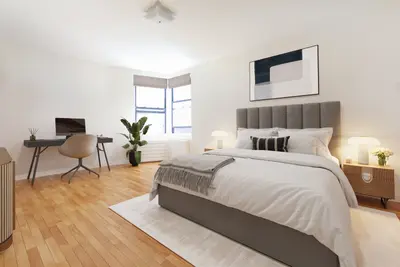
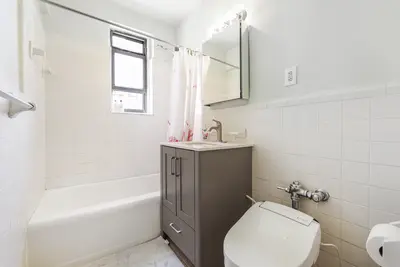
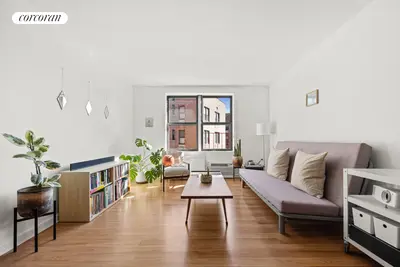
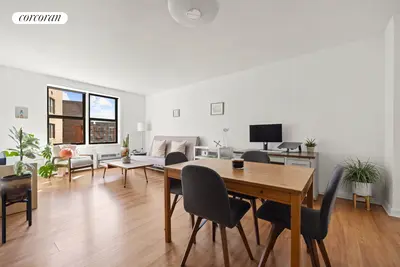
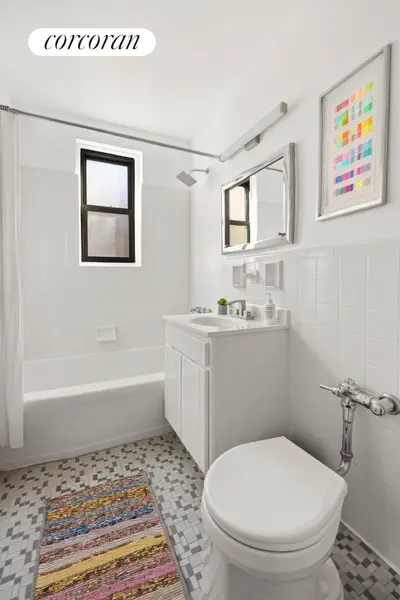
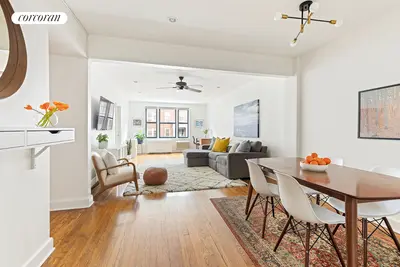
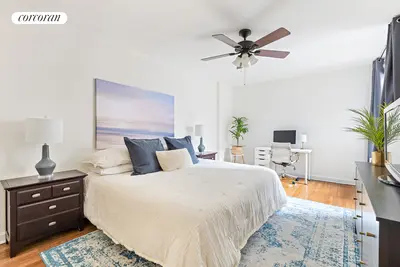
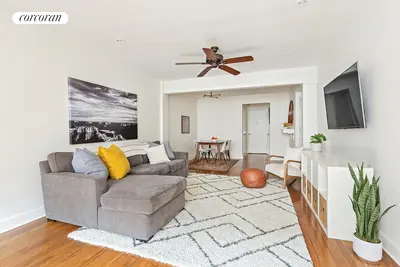
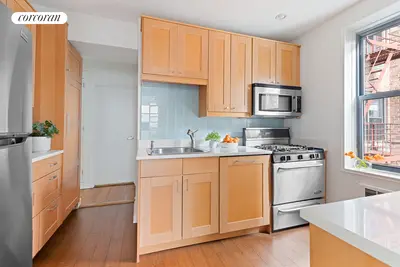
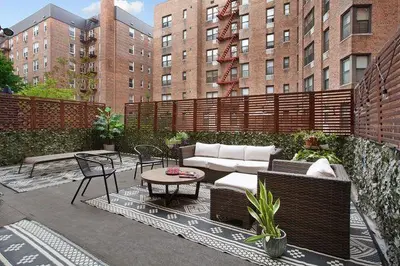
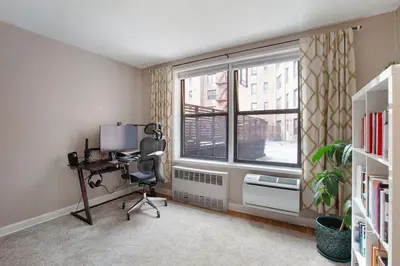
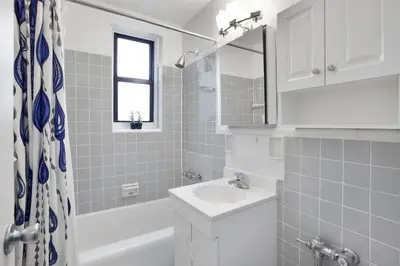
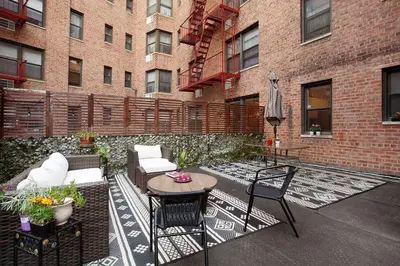
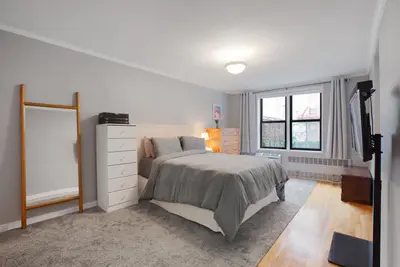
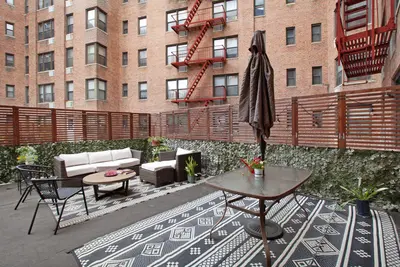
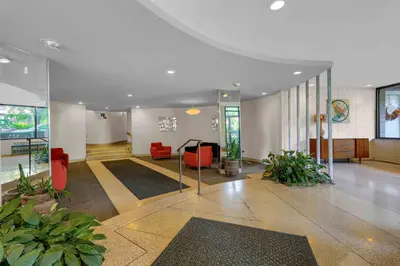
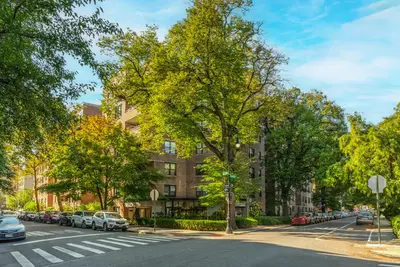
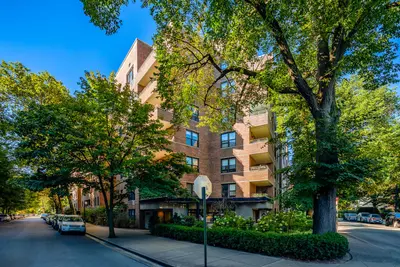
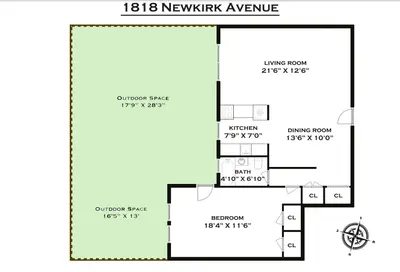
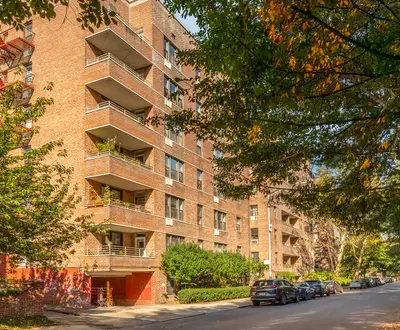
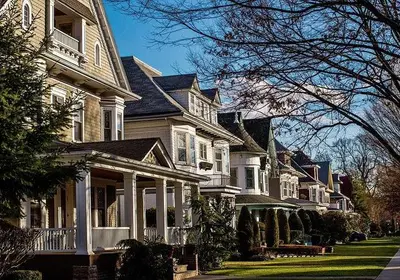
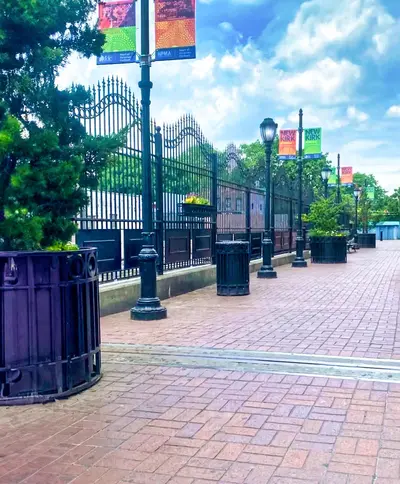

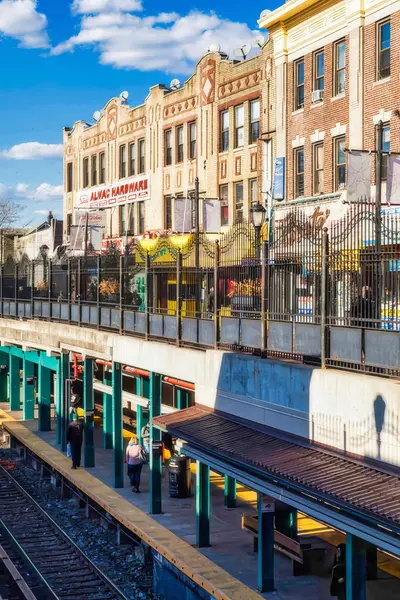
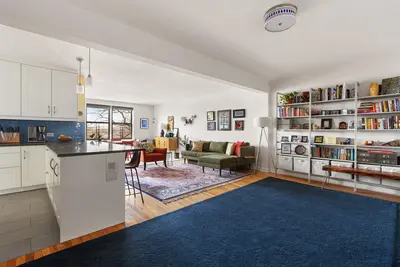
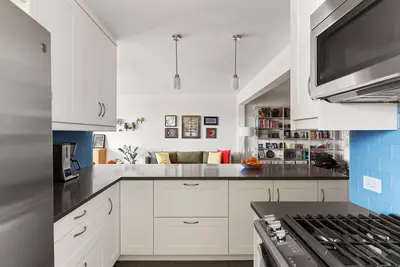
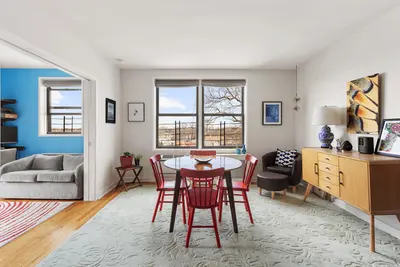
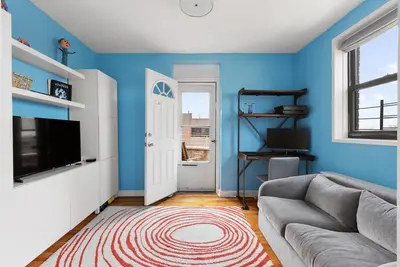
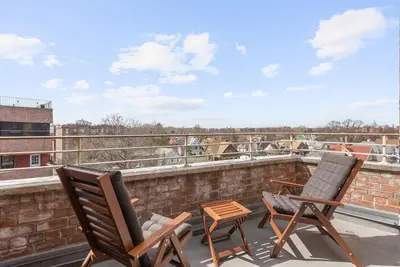
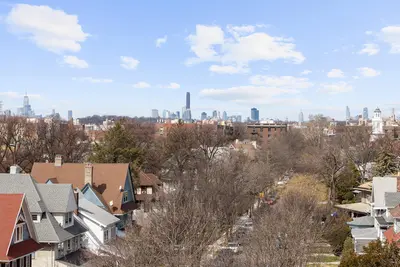
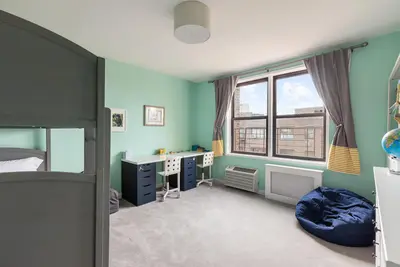
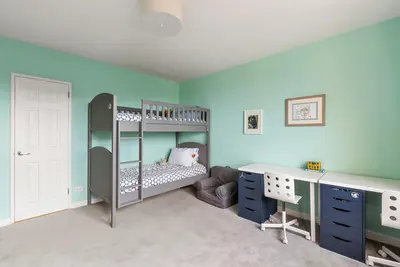
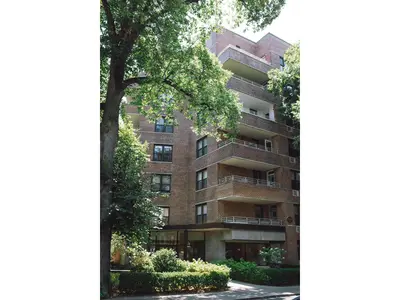
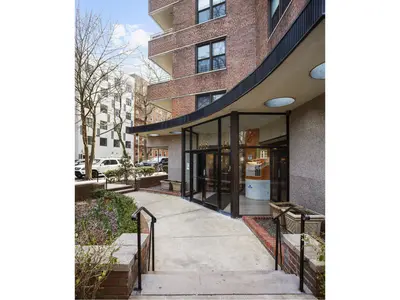
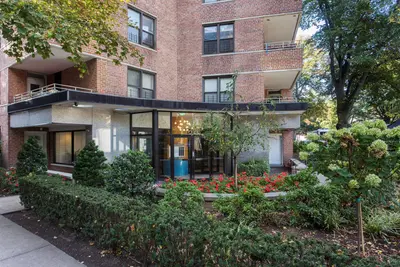
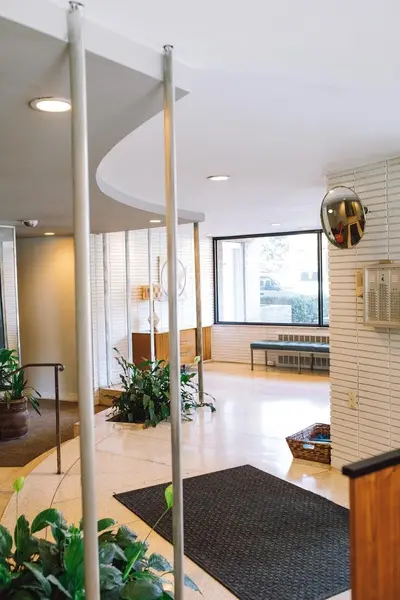
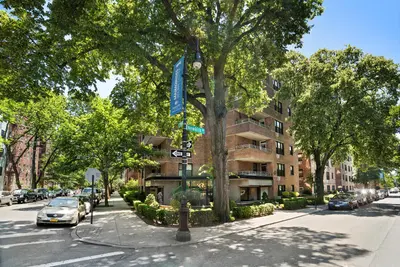
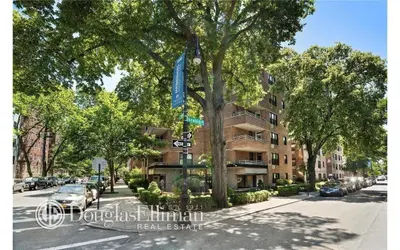
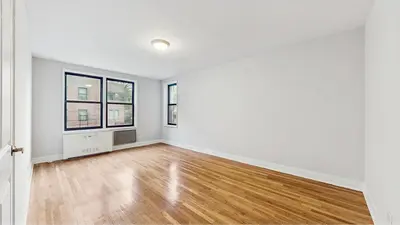
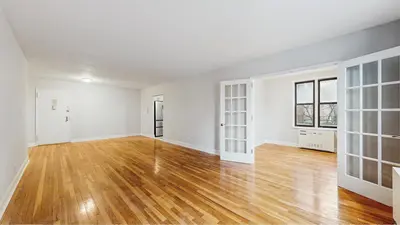
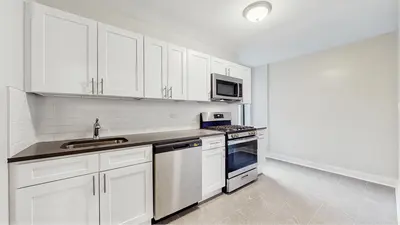
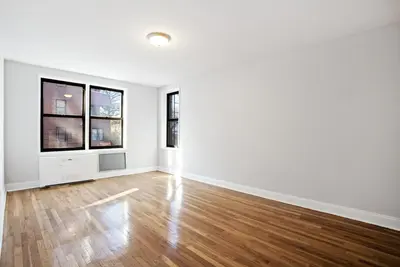
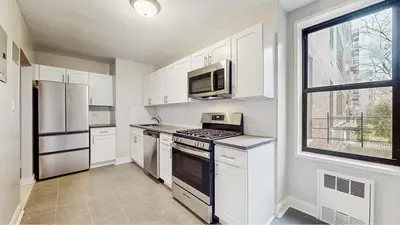
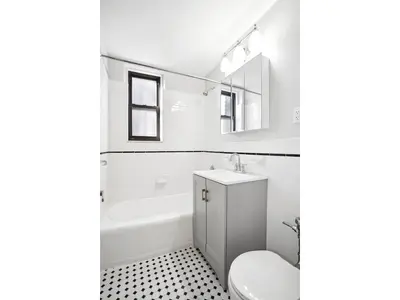
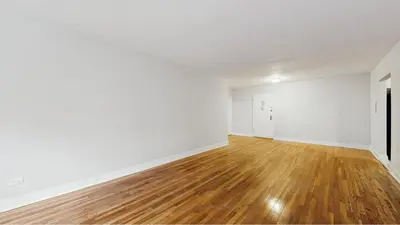
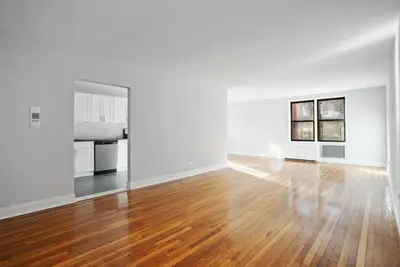
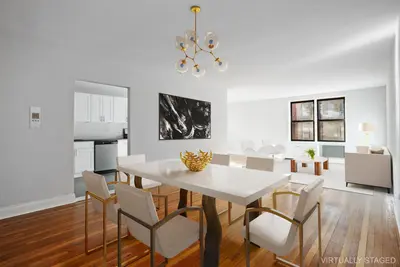
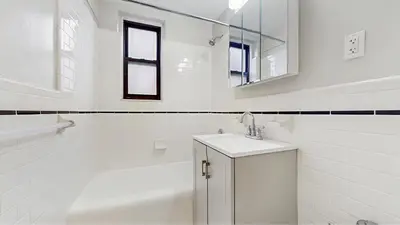
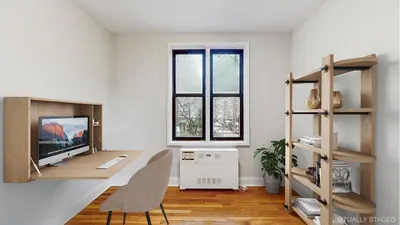
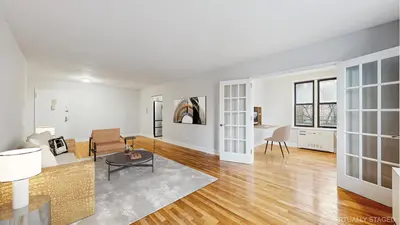
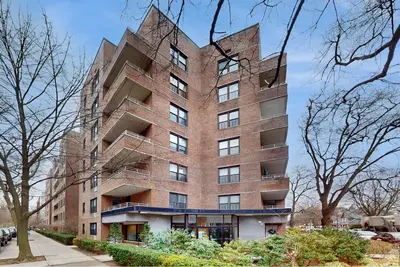
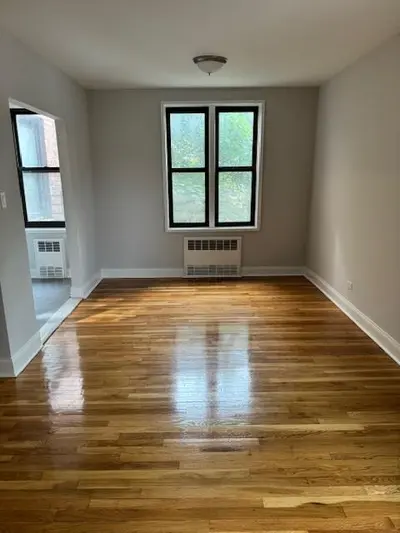
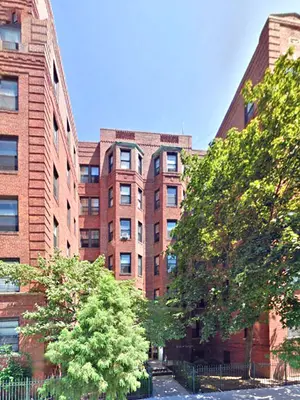
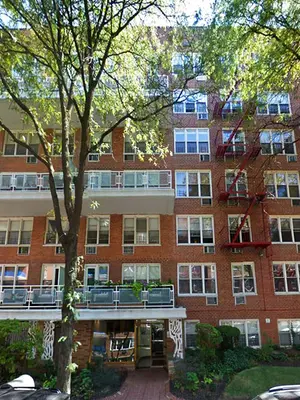
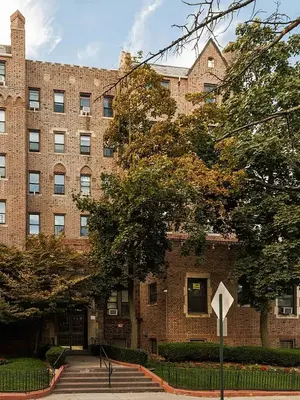
1818 Newkirk Avenue was built in 1958 and has a total of 134 apartments. Located in Flatbush, 1818 Newkirk Avenue is very close to the B and Q subway lines.
There are currently 3 apartments for sale at 1818 Newkirk Avenue, ranging in price from $476,000 to $599,000. The most recent closing in the building was in January 2025 - a six plus bedroom that closed for $729,000.
During the past two years, 10 apartments have sold: the most expensive was a two bedroom that sold for $995,000, and the least expensive was a six plus bedroom that sold for $295,000.
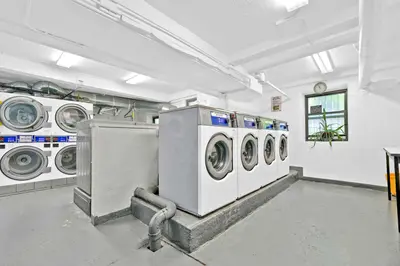
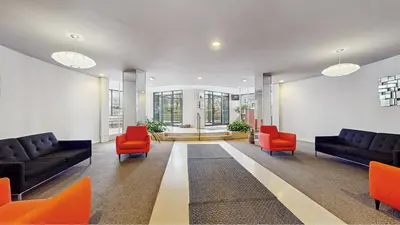
Amenities at this post war building include doorman.
Similar nearby buildings include 616 East 18th Street, 645 East 26th Street, 415 Argyle Road and 800 East 17th Street.
Interested in off-market listings at 1818 Newkirk Avenue? Some previously listed residences might be available – contact us for insider details on potential opportunities!
View school info, local attractions, transportation options & more.
Experience amazing 3D aerial maps and fly throughs.
For some co-ops, instead of price per square foot, we use an estimate of the number of rooms for each sold apartment to chart price changes over time. This is because many co-op listings do not include square footage information, and this makes it challenging to calculate accurate square-foot averages.
By displaying the price per estimated room count, we are able to provide a more reliable and consistent metric for comparing sales in the building. While we hope that this gives you a clearer sense of price trends in the building, all data should be independently verified. All data provided are only estimates and should not be used to make any purchase or sale decision.
|
Year
Avg Price / Ft2 (Est)
Median Price / Ft2 (Est)
Avg. Actual Price
Med. Actual Price
Transactions
2025
-
$729,000
-
$729,000
1
2024
$549
$588,333
$518
$530,000
6
2023
$701
$729,667
$701
$699,000
3
2022
$536
$295,000
$536
$295,000
1
2021
$652
$569,375
$651
$569,500
8
2020
$638
$645,929
$633
$645,000
7
2019
$641
$733,500
$623
$704,500
4
2018
$621
$656,000
$621
$655,000
3
2017
$555
$473,034
$538
$456,000
8
2016
$567
$521,000
$597
$599,000
6
2015
$547
$483,798
$557
$499,596
4
2014
$470
$449,952
$454
$417,500
10
|
Year
Avg Price / Ft2 (Est)
Median Price / Ft2 (Est)
Avg. Actual Price
Med. Actual Price
Transactions
2013
$331
$375,648
$366
$385,000
5
2012
$327
$394,757
$355
$377,742
5
2011
$325
$364,633
$322
$354,000
5
2010
$346
$376,498
$349
$350,000
11
2009
-
$349,294
$365,000
4
2008
$267
$355,689
$343
$367,686
8
2007
$301
$279,041
$306
$273,500
14
2006
$272
$271,135
$264
$259,114
23
2005
$264
$224,228
$278
$233,984
14
2004
$126
$126,673
$121
$117,123
9
2003
$86
$91,833
$86
$90,000
11
Please note that price/ft2 calculations is from only 54% of total transactions during the period
|
the following is a slider of images. For screen reader users, all slides are visible at all time so you may ignore control buttons.


Sign-up and we'll email you new listings in this building!
Whether you’re a buyer, investor, or simply curious, this report is your key to unlocking in-depth insights and analysis on .
Please confirm your details: