21 East 22nd Street - Flatiron/Union Square
- Apartments
- Overview & Photos
- Maps
- Floorplans
- Sales Data & Comps
- Similar Buildings
- All Units


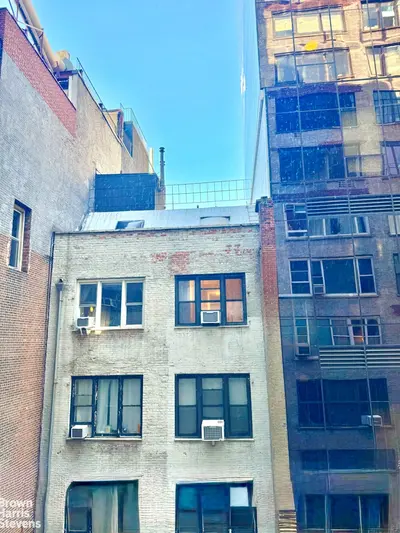


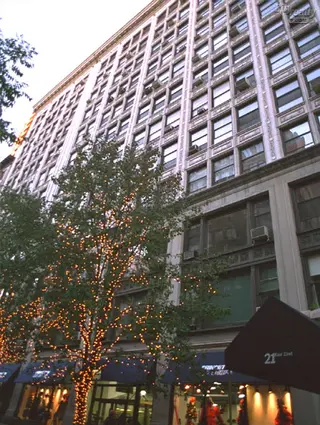
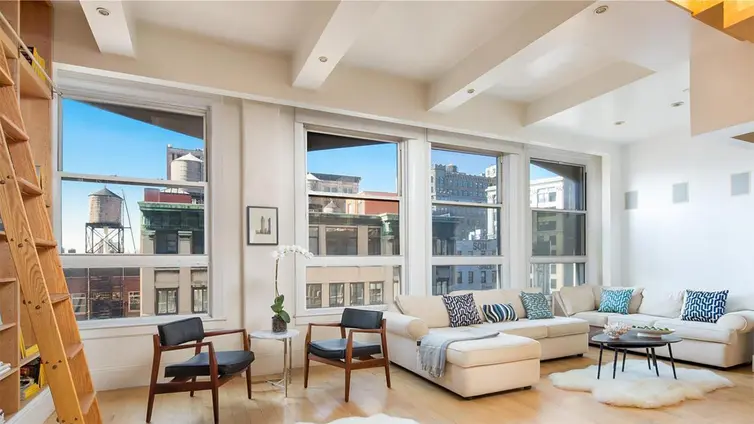
21 East 22nd Street is a 12-story pre-war commercial building converted into 126 cooperative apartments. Built in 1911, the structure features a distinctive three-story limestone base with decorative piers between its large windows and an ornate cornice. The building's architecture indicates it was developed in two stages, with the western third showing wider spacing between window bays.
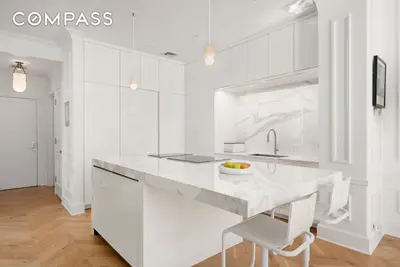
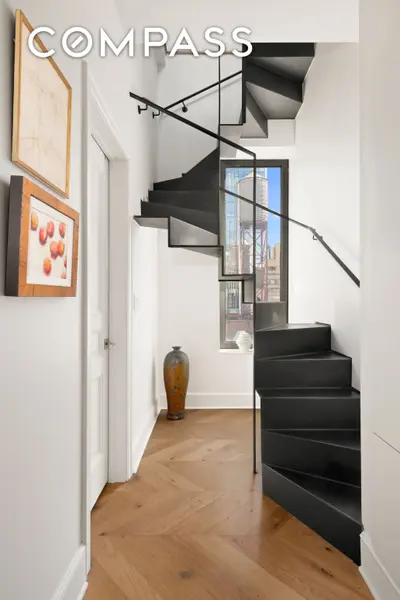
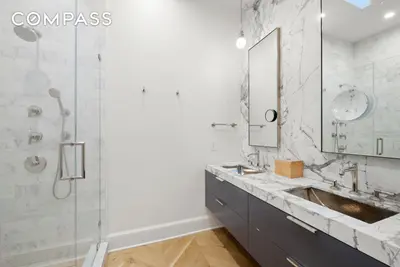
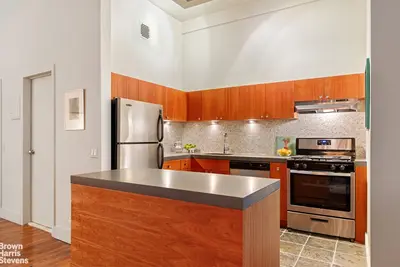
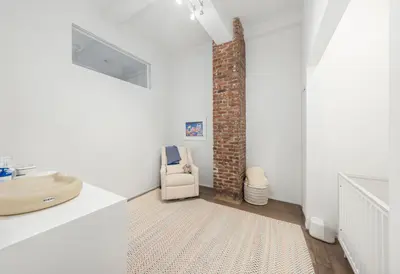
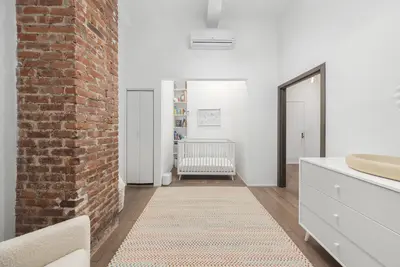
The full-service building offers numerous amenities including a 24-hour doorman, live-in superintendent, refrigerated storage for deliveries, bike room, and laundry facilities on each floor. Recent upgrades include a renovated lobby, and residents enjoy access to a landscaped roof deck with city views. The co-op is well-run and financially sound, maintaining low monthly maintenance fees while allowing pied-à-terres, pets, and guarantors.
Situated on a tree-lined block in the Flatiron District, the building sits half a block from the iconic Flatiron Building and provides easy access to Madison Square Park and Eataly. The location offers excellent transportation options with the N, R, W, and 6 subway lines nearby, as well as proximity to numerous acclaimed restaurants and shopping destinations.


View school info, local attractions, transportation options & more.
Experience amazing 3D aerial maps and fly throughs.
For some co-ops, instead of price per square foot, we use an estimate of the number of rooms for each sold apartment to chart price changes over time. This is because many co-op listings do not include square footage information, and this makes it challenging to calculate accurate square-foot averages.
By displaying the price per estimated room count, we are able to provide a more reliable and consistent metric for comparing sales in the building. While we hope that this gives you a clearer sense of price trends in the building, all data should be independently verified. All data provided are only estimates and should not be used to make any purchase or sale decision.