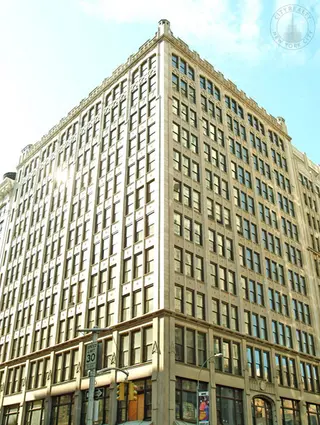
254 Park Avenue South: Sales Summary
between East 20th Street & East 21st Street Building Profile
All Sales
$1,546
Avg. Price / ft2
Past 12 months, based on 5 sales
$1,584,000
Avg. Price -
Past 12 months, based on 5 sales
$1,435
Median Price / ft2
Past 12 months, based on 5 sales
$1,650,000
Median Price
Past 12 months, based on 5 sales
Year
Avg Price / Ft2
Median Price / Ft2
Avg. Actual Price
Med. Actual Price
Transactions
2025
$1,435
$2,400,000
$1,435
$2,400,000
1
2024
$1,636
$1,798,241
$1,739
$1,650,000
5
2023
$1,368
$1,330,000
$1,368
$1,330,000
2
2022
$1,468
$1,053,750
$1,584
$1,070,000
4
2021
$1,481
$1,454,829
$1,459
$1,376,250
14
2020
$1,783
$1,300,000
$1,783
$1,300,000
1
2019
$1,612
$1,638,500
$1,594
$1,482,500
5
2018
$1,813
$1,687,963
$1,712
$1,562,500
6
2017
$1,812
$2,020,741
$1,792
$1,780,000
7
2016
$1,463
$972,571
$1,643
$778,000
7
2015
$1,381
$990,477
$1,349
$965,000
8
2014
$1,535
$1,096,596
$1,557
$990,000
13
2013
$1,427
$1,217,666
$1,330
$908,789
22
Year
Avg Price / Ft2
Median Price / Ft2
Avg. Actual Price
Med. Actual Price
Transactions
2012
$1,225
$1,097,881
$1,175
$1,023,341
14
2011
$1,207
$1,293,903
$1,211
$1,142,329
13
2010
$1,252
$1,164,596
$1,279
$1,099,855
44
2009
$1,332
$1,312,511
$1,279
$1,380,000
5
2008
-
-
-
-
0
2007
-
-
-
-
0
2006
-
-
-
-
0
2005
-
-
-
-
0
2004
-
-
-
-
0
2003
-
-
-
-
0
The Breakdown of All Sales by Apartment Size