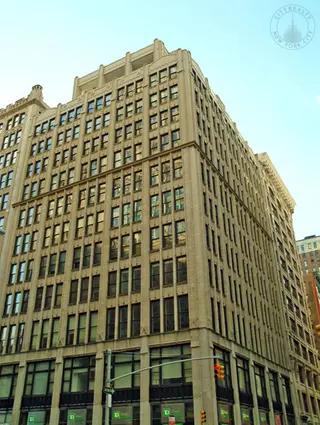
260 Park Avenue South: Sales Summary
between East 20th Street & East 21st Street Building Profile
All Sales
$1,680
Avg. Price / ft2
Past 12 months, based on 5 sales
$2,876,000
Avg. Price -
Past 12 months, based on 5 sales
$1,581
Median Price / ft2
Past 12 months, based on 5 sales
$2,495,000
Median Price
Past 12 months, based on 5 sales
Year
Avg Price / Ft2
Median Price / Ft2
Avg. Actual Price
Med. Actual Price
Transactions
2025
$1,581
$2,100,000
$1,581
$2,100,000
1
2024
$1,653
$2,721,000
$1,562
$2,495,000
5
2023
$1,631
$2,244,000
$1,619
$2,150,000
5
2022
$1,984
$3,914,286
$1,772
$3,900,000
7
2021
$1,735
$3,218,091
$1,669
$2,275,000
11
2020
$1,685
$2,412,083
$1,685
$2,412,083
2
2019
$1,870
$2,506,667
$1,928
$2,470,000
3
2018
$1,873
$2,612,000
$1,834
$2,700,000
5
2017
$1,771
$3,231,313
$1,834
$2,605,000
4
2016
$2,073
$3,320,000
$1,930
$3,172,500
6
2015
$1,859
$2,692,234
$1,855
$2,467,188
8
2014
$1,777
$2,315,778
$1,660
$1,721,000
9
2013
$1,505
$1,857,444
$1,487
$1,975,000
9
Year
Avg Price / Ft2
Median Price / Ft2
Avg. Actual Price
Med. Actual Price
Transactions
2012
$1,692
$3,520,417
$1,566
$2,122,500
12
2011
$1,461
$2,118,333
$1,482
$2,175,000
6
2010
$1,217
$1,663,792
$1,218
$1,407,500
12
2009
$1,243
$1,825,950
$1,225
$1,635,000
10
2008
$1,446
$2,039,500
$1,446
$2,032,500
14
2007
$1,472
$2,930,003
$1,486
$2,775,000
12
2006
$1,115
$1,651,501
$1,121
$1,527,375
109
2005
-
-
-
-
0
2004
-
-
-
-
0
2003
-
-
-
-
0
The Breakdown of All Sales by Apartment Size