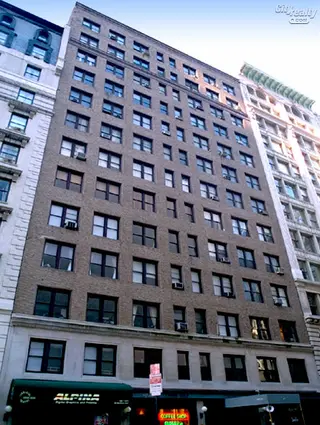
The Madison Parq, 66 Madison Avenue: Sales Summary
between East 27th Street & East 28th Street Building Profile
All Sales
$848
Avg. Price / ft2
Past 12 months, based on 4 sales
$608,125
Avg. Price -
Past 12 months, based on 4 sales
$848
Median Price / ft2
Past 12 months, based on 4 sales
$665,000
Median Price
Past 12 months, based on 4 sales
Year
Avg Price / Ft2
Median Price / Ft2
Avg. Actual Price
Med. Actual Price
Transactions
2025
$767
$551,250
$767
$551,250
2
2024
$929
$660,000
$929
$650,000
3
2023
$1,351
$926,667
$947
$675,000
6
2022
$977
$589,500
$914
$640,000
5
2021
$1,086
$756,321
$1,095
$640,000
7
2020
$1,179
$531,111
$1,307
$541,500
6
2019
$1,175
$1,139,333
$1,175
$1,225,000
3
2018
$1,139
$628,833
$1,139
$555,000
6
2017
$1,378
$814,071
$1,110
$670,000
14
2016
$965
$740,300
$965
$627,500
5
2015
$879
$648,625
$779
$500,000
8
2014
$886
$508,000
$868
$520,000
11
2013
$705
$408,114
$650
$415,000
11
Year
Avg Price / Ft2
Median Price / Ft2
Avg. Actual Price
Med. Actual Price
Transactions
2012
$663
$387,215
$678
$398,750
8
2011
$612
$527,375
$545
$403,500
8
2010
$614
$399,188
$600
$430,000
8
2009
$597
$397,938
$572
$372,500
8
2008
$827
$547,700
$827
$475,000
5
2007
$708
$518,245
$708
$458,250
18
2006
$687
$502,334
$697
$530,500
16
2005
$539
$363,218
$509
$330,000
16
2004
$500
$283,143
$500
$282,000
7
2003
$463
$311,714
$450
$267,000
7
The Breakdown of All Sales by Apartment Size

 6sqft delivers the latest on real estate, architecture, and design, straight from New York City.
