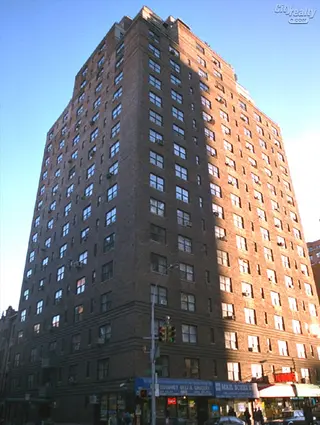
200 East 16th Street - Gramercy Park
- Apartments
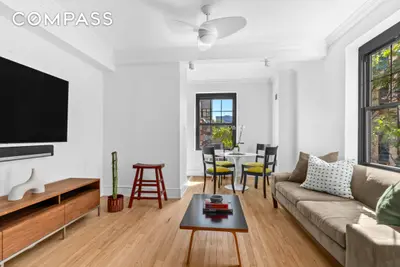
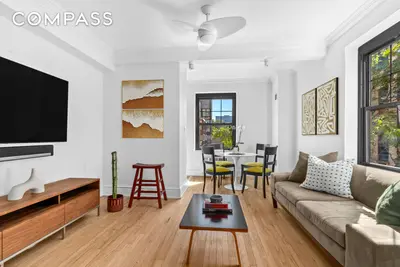
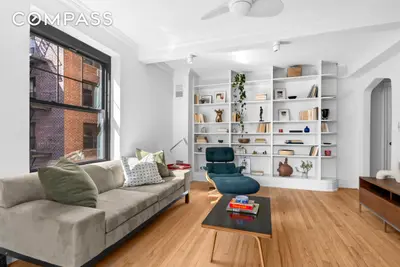
- Overview & Photos
- Maps
- Floorplans
- Sales Data & Comps
- Similar Buildings
- All Units

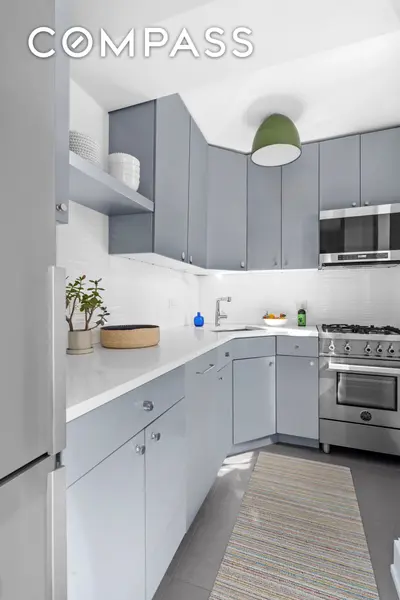
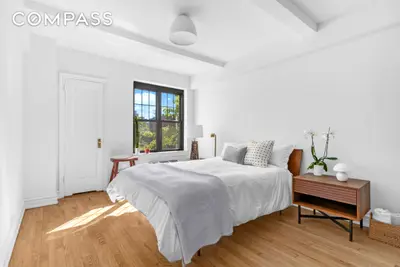
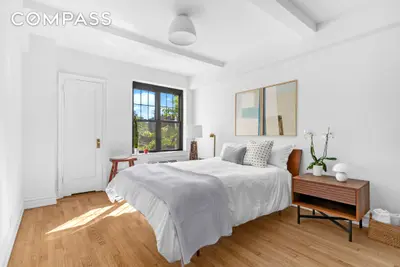
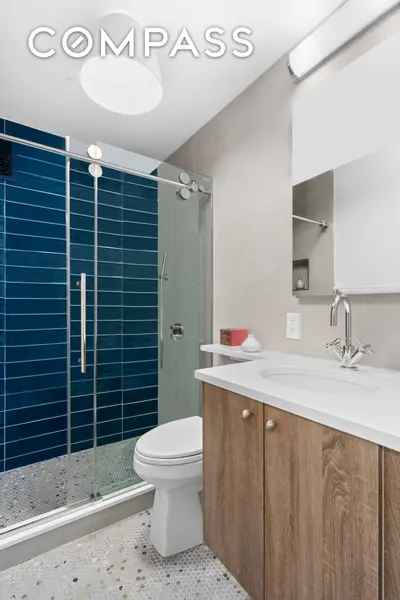
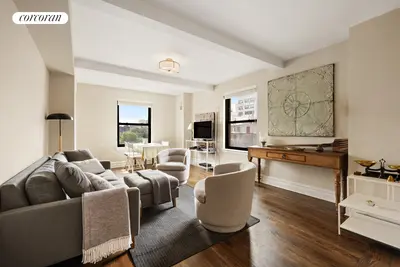
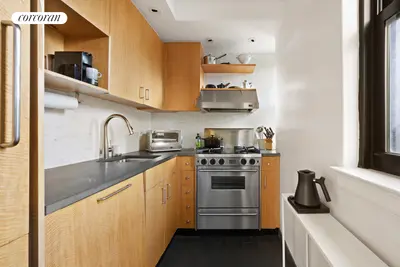
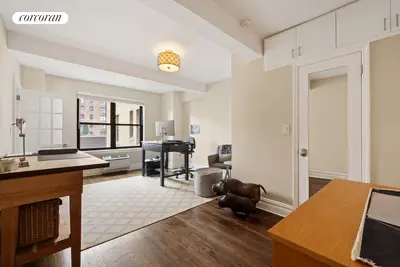
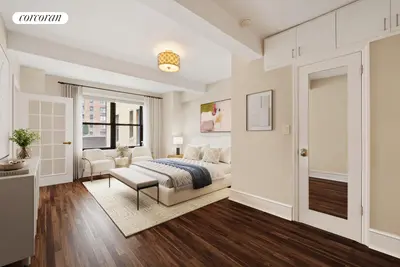
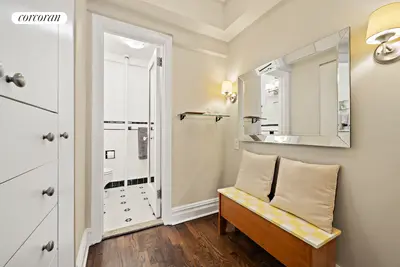
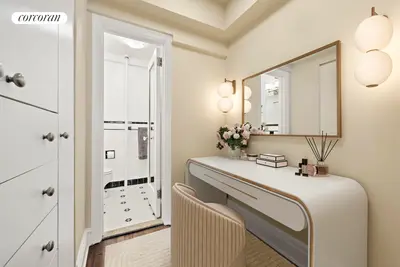
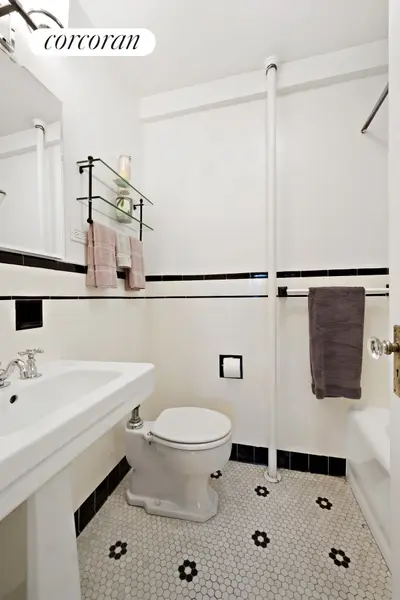
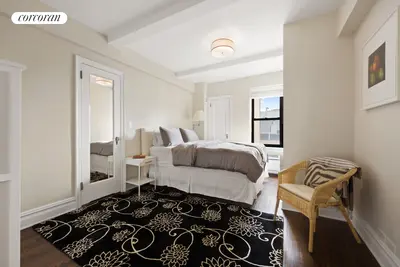
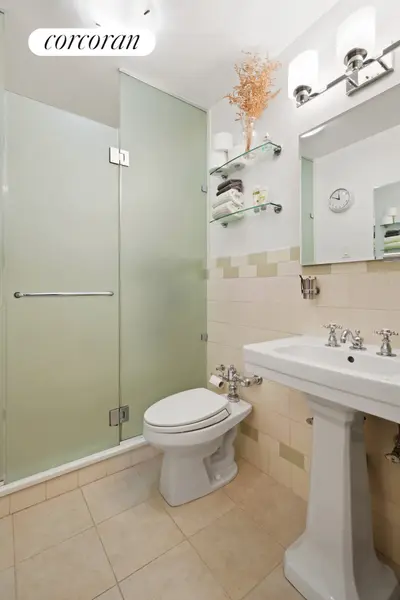
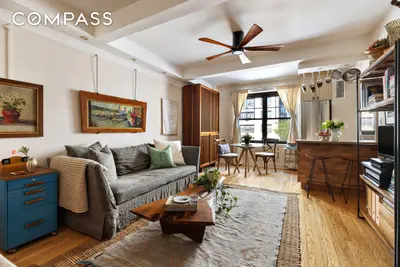
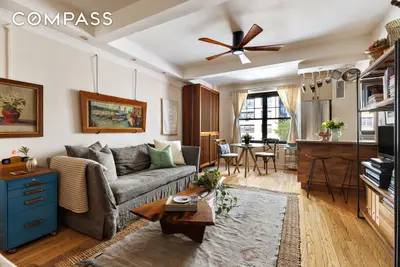
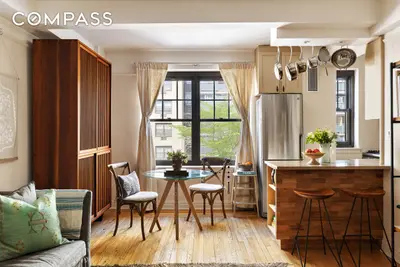

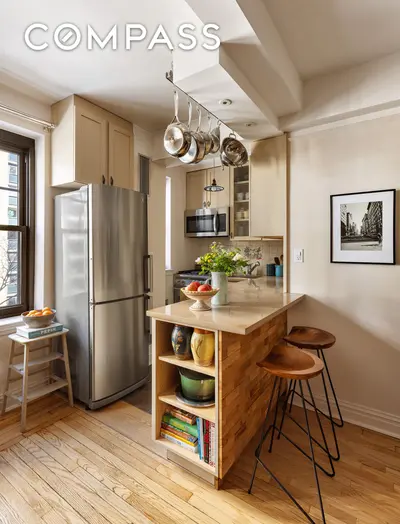

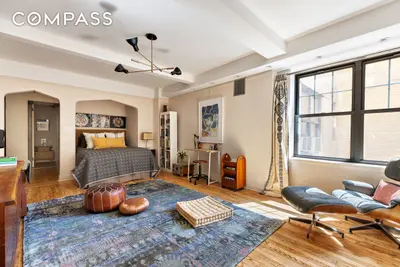

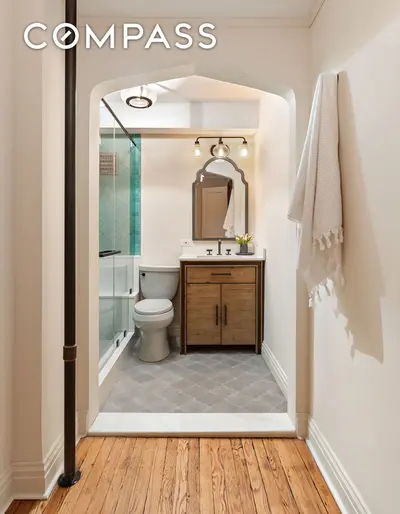


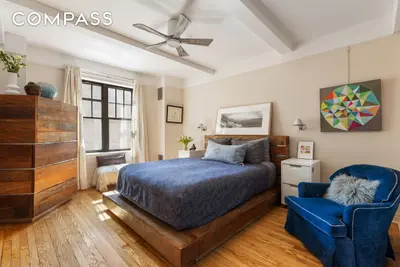
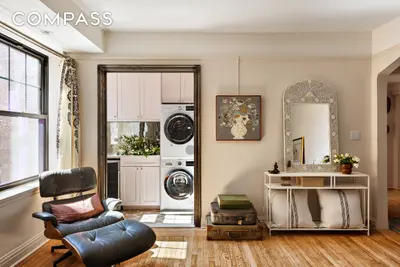

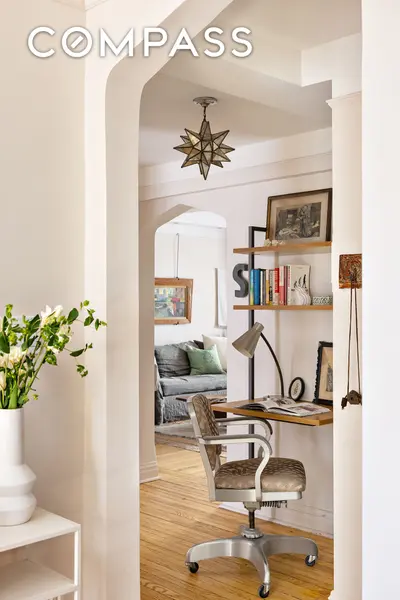
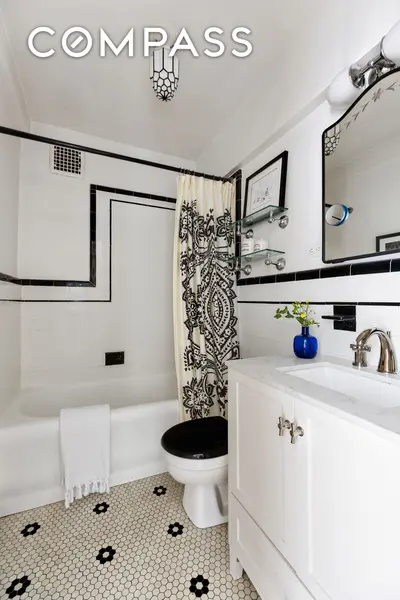

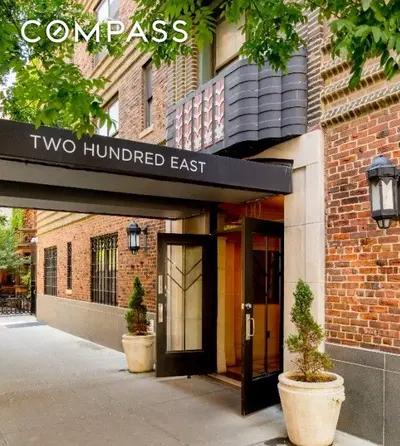

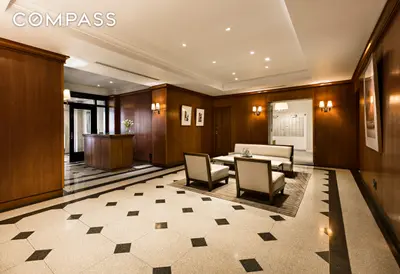


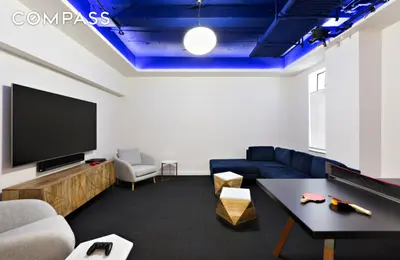

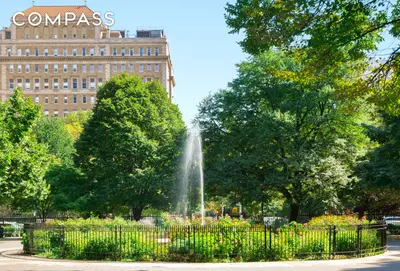

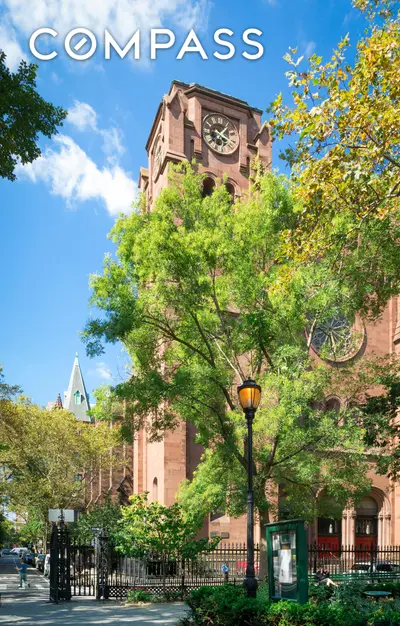
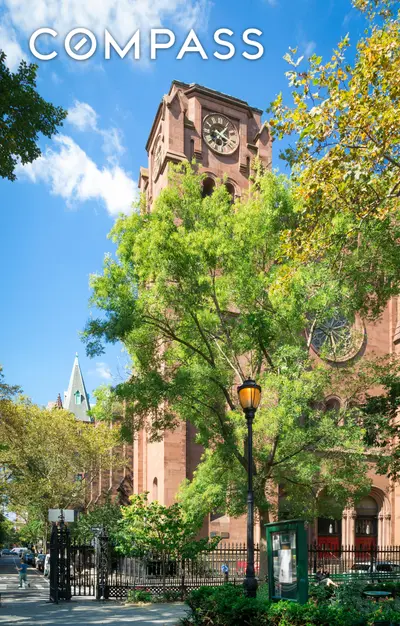
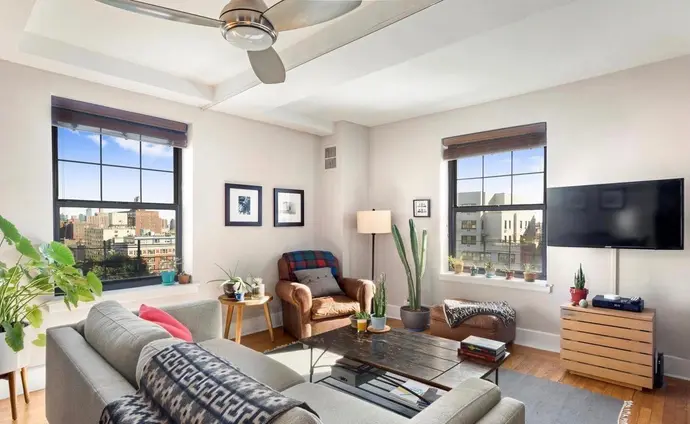
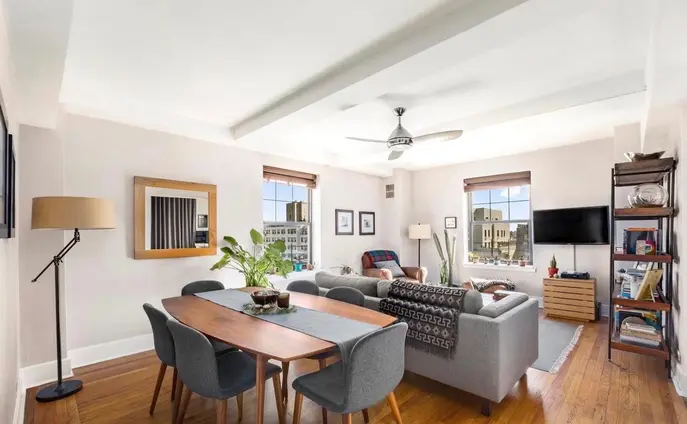
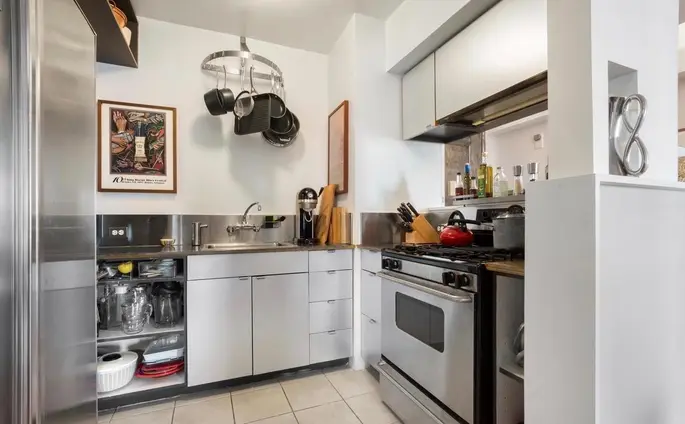
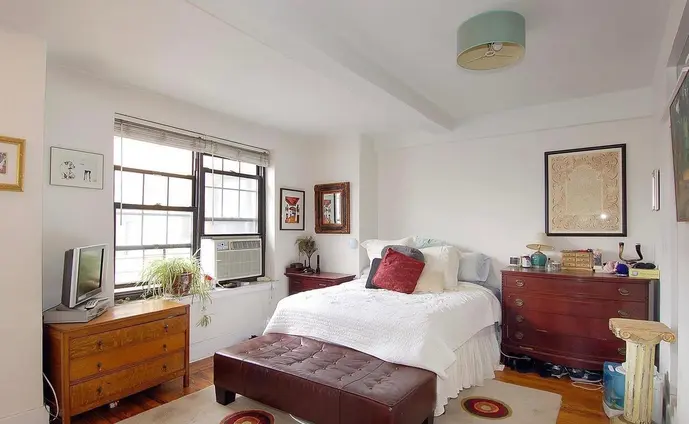
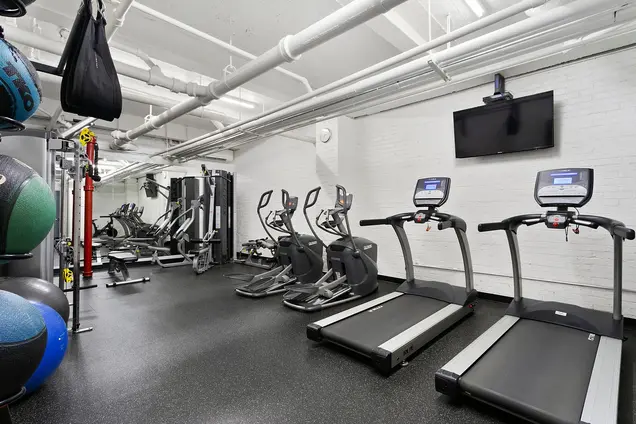
200 East 16th Street is a 20-story, 194-unit prewar cooperative with a full-time doorman, live-in superintendent, and central laundry room. Utilities are included in the maintenance, and the building is well situated near Stuyvesant and Rutherford Parks, the Union Square greenmarket and transportation hub, fine dining, Westside Market, Trader Joe's, Whole Foods, and the nationally landmarked St. George's Church and the Friends Seminary. Co-purchasing, pied-a-terres, gifting, and guarantors are all permitted, as is unlimited subletting after one year.


View school info, local attractions, transportation options & more.
Experience amazing 3D aerial maps and fly throughs.
For some co-ops, instead of price per square foot, we use an estimate of the number of rooms for each sold apartment to chart price changes over time. This is because many co-op listings do not include square footage information, and this makes it challenging to calculate accurate square-foot averages.
By displaying the price per estimated room count, we are able to provide a more reliable and consistent metric for comparing sales in the building. While we hope that this gives you a clearer sense of price trends in the building, all data should be independently verified. All data provided are only estimates and should not be used to make any purchase or sale decision.
Broker & Buyer Comments