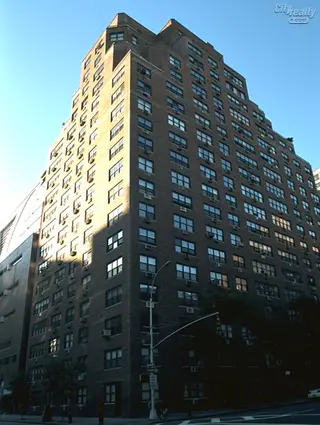
330 Third Avenue - Gramercy Park
- Apartments
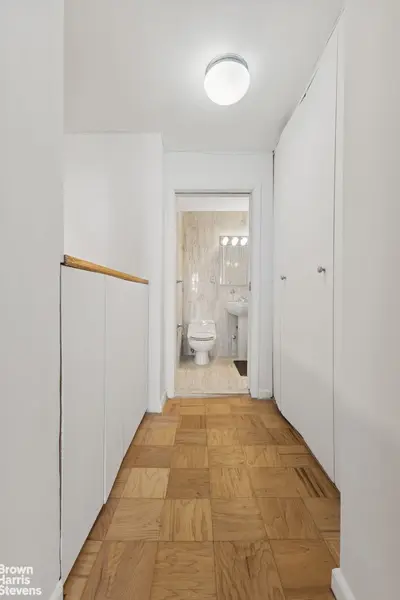
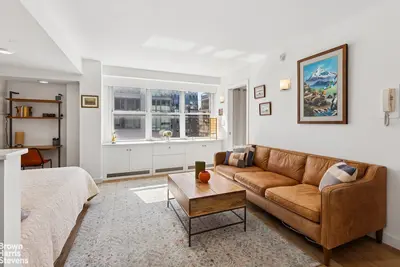
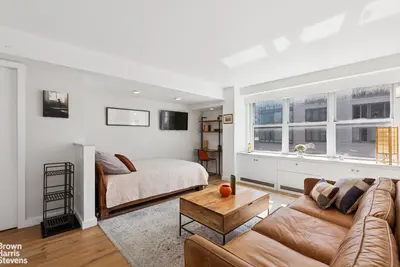
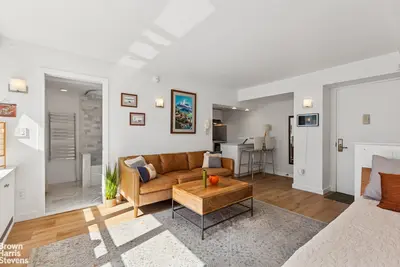
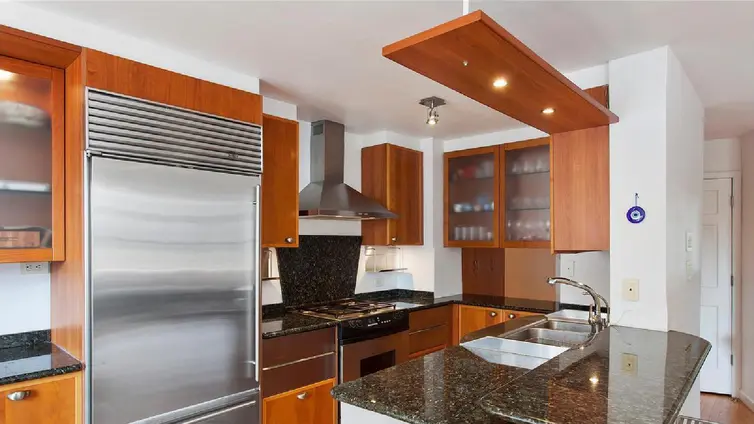
- Overview & Photos
- Maps
- Floorplans
- Sales Data & Comps
- Similar Buildings
- All Units
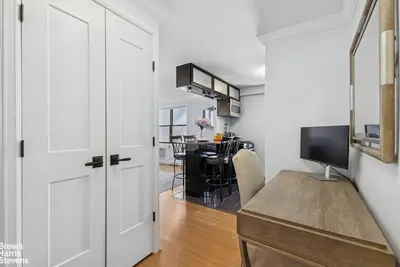

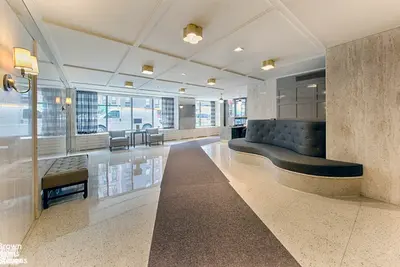
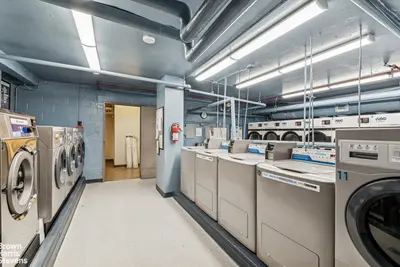
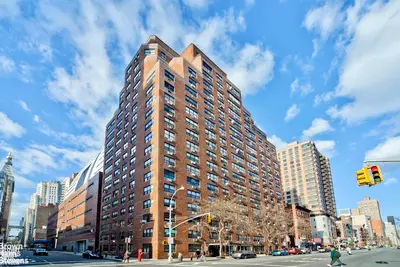

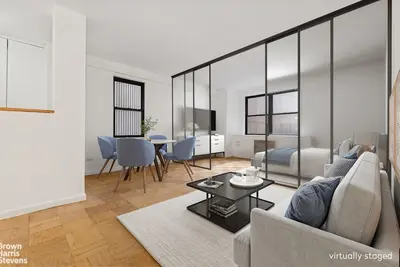
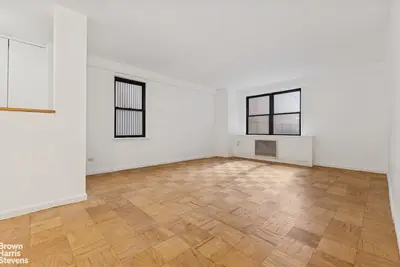
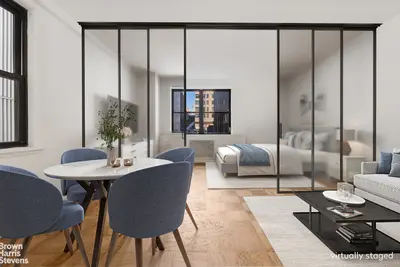
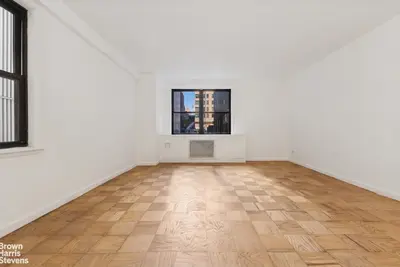

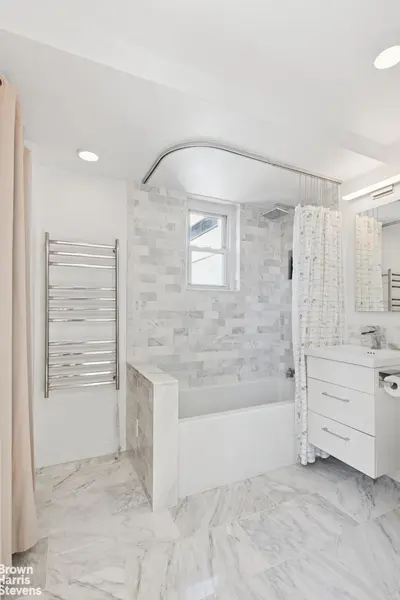


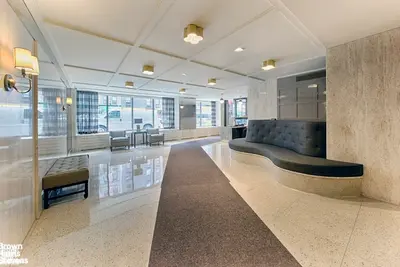
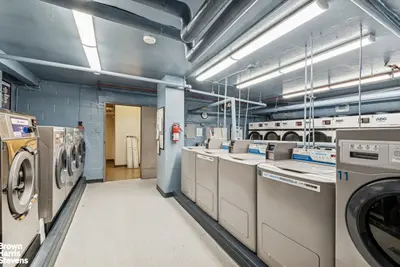
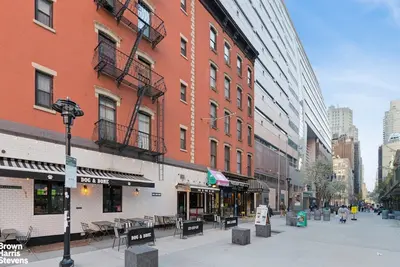
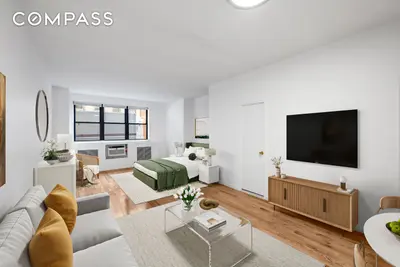
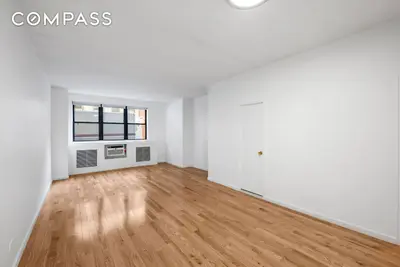
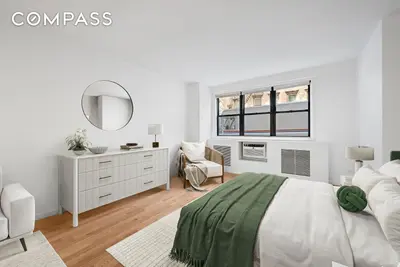
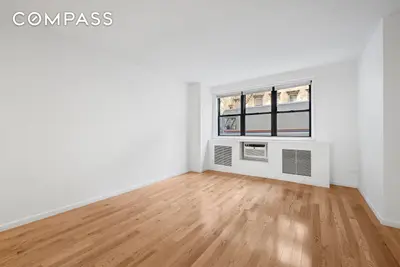
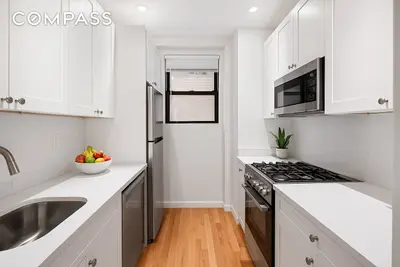
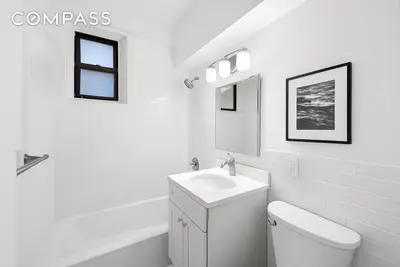
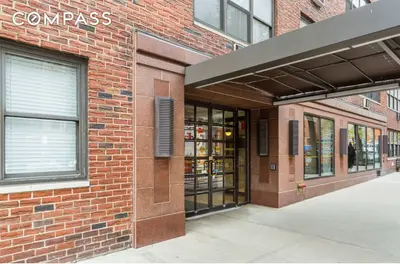
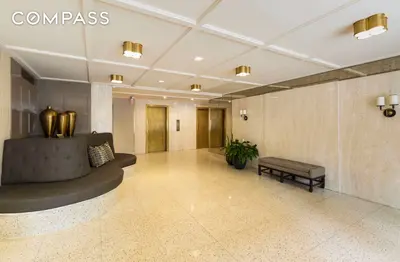
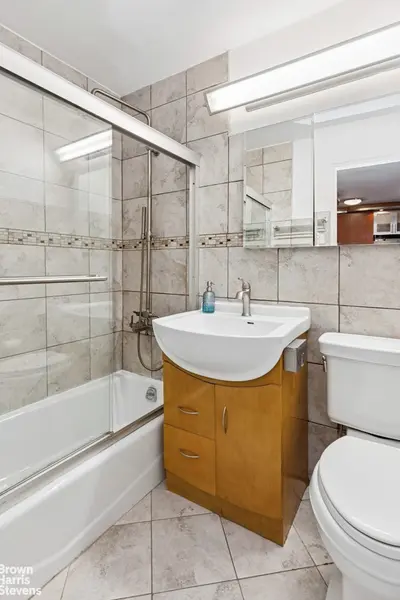
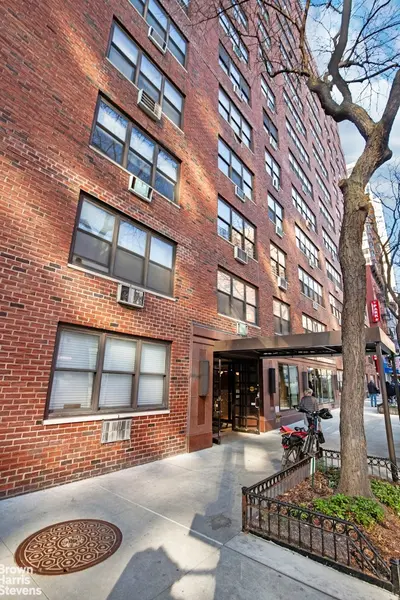
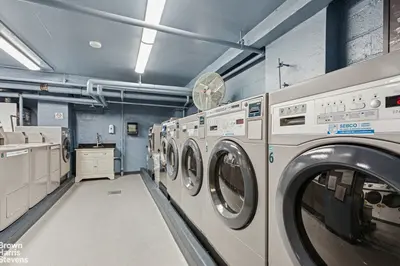
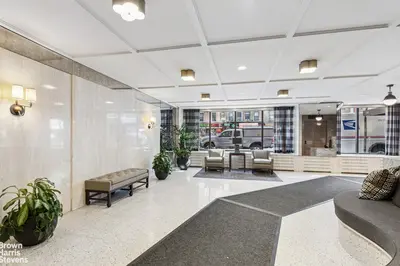
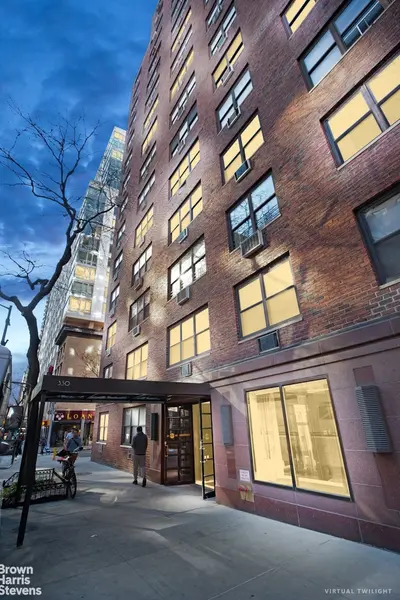
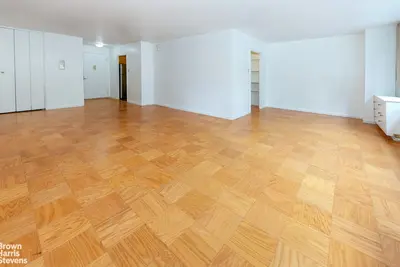
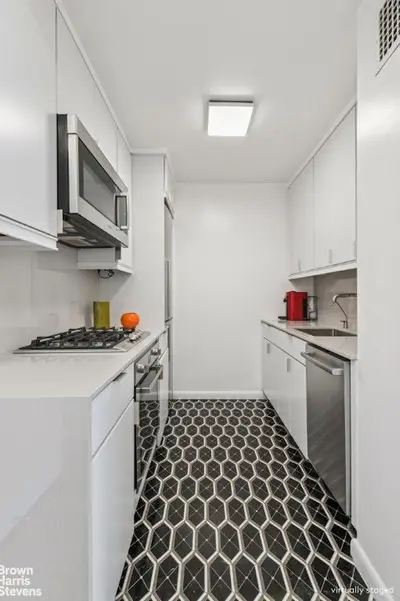
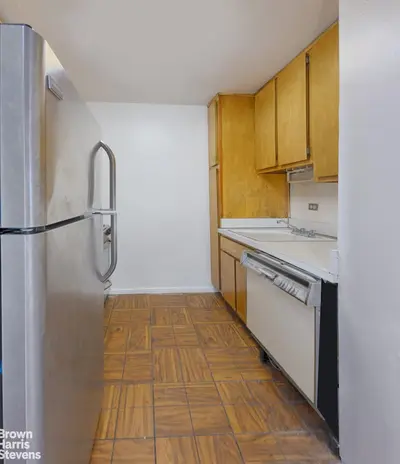

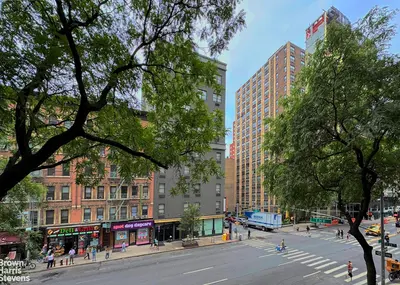
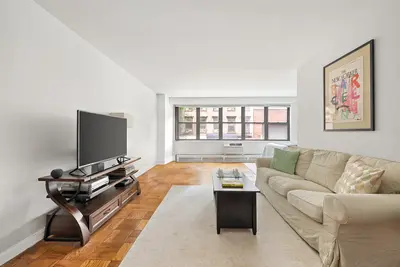
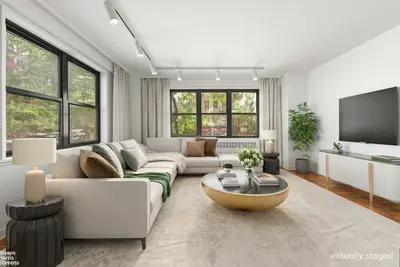
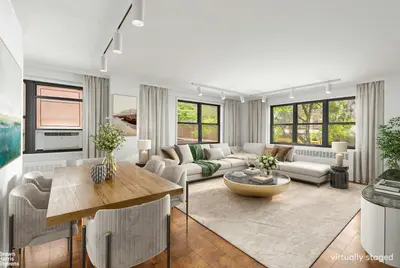
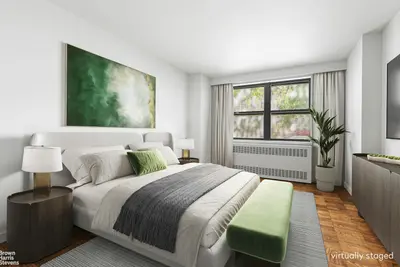
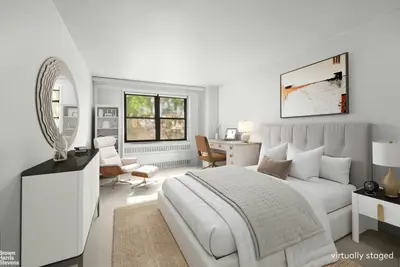

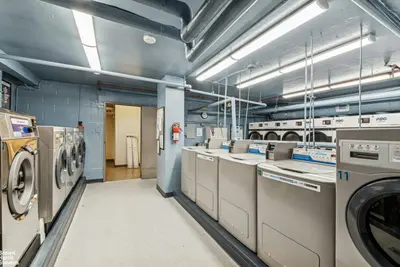
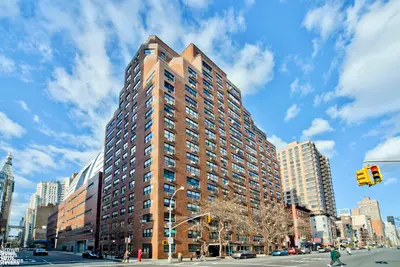

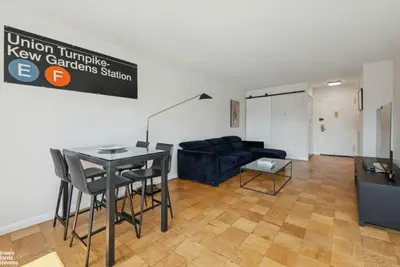
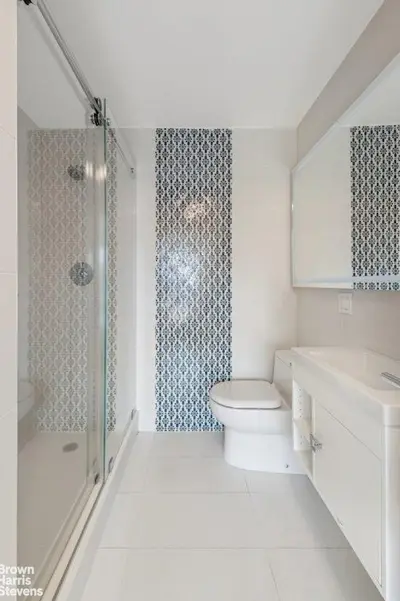
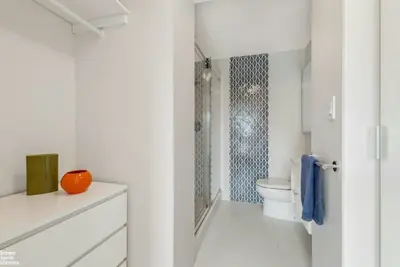

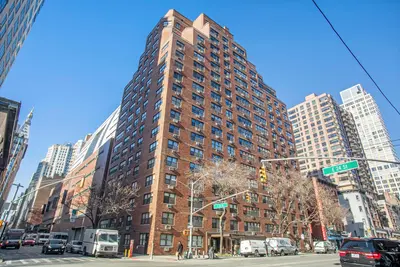

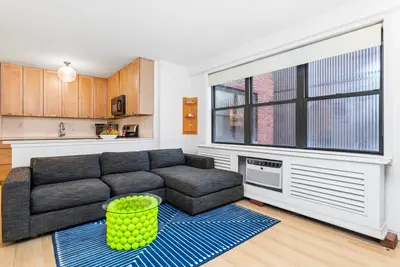
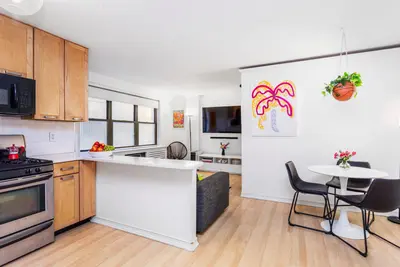
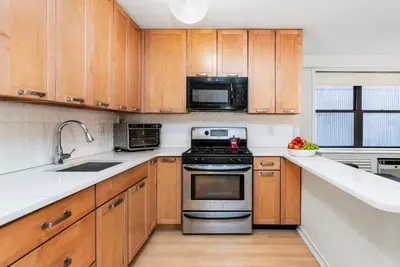
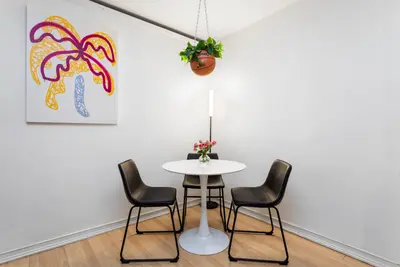
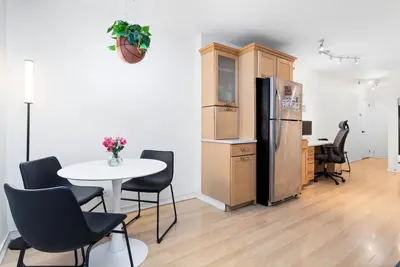


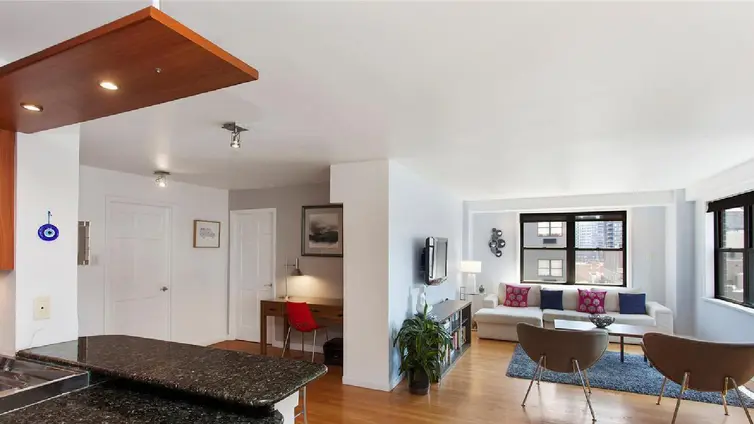
330 Third Avenue is a cooperative with a full time doorman, resident superintendent, laundry room, bike room and storage room. It is located near major transportation including the 6, N, Q, R, F, M, 1, and L trains, as well as an express bus stop across the street. There are plenty of supermarkets within walking distance including D'Agostino's, Morton-Williams and Trader Joe's. Pied-A-Terre purchases are allowed, as well as parents co-purchasing. Dogs up to 40 pounds are welcome. Subletting is allowed after two years of residency.

View school info, local attractions, transportation options & more.
Experience amazing 3D aerial maps and fly throughs.
For some co-ops, instead of price per square foot, we use an estimate of the number of rooms for each sold apartment to chart price changes over time. This is because many co-op listings do not include square footage information, and this makes it challenging to calculate accurate square-foot averages.
By displaying the price per estimated room count, we are able to provide a more reliable and consistent metric for comparing sales in the building. While we hope that this gives you a clearer sense of price trends in the building, all data should be independently verified. All data provided are only estimates and should not be used to make any purchase or sale decision.