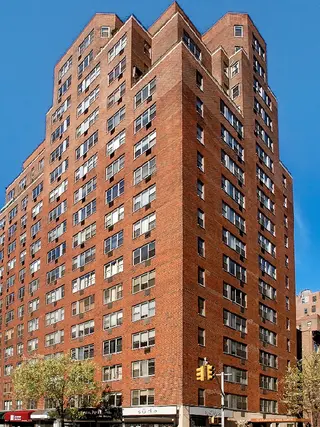
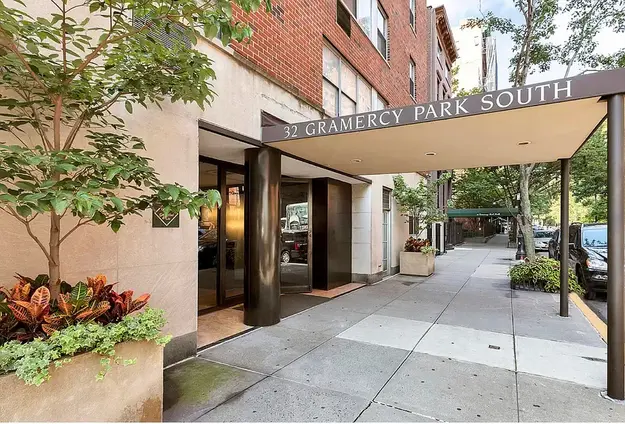
Gramercy Towers, 32 Gramercy Park South - Gramercy Park
- Apartments
- Overview & Photos
- Maps
- Floorplans
- Sales Data & Comps
- Similar Buildings
- All Units
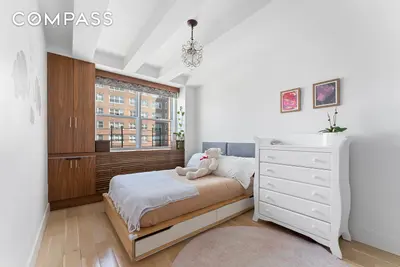
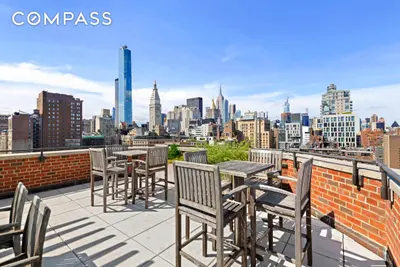
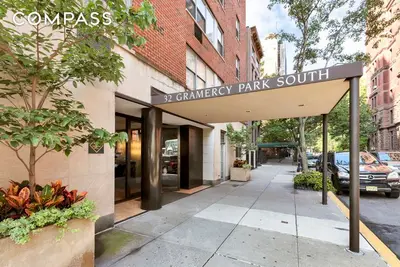
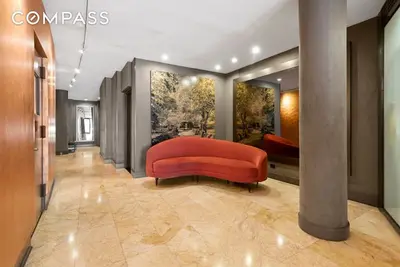

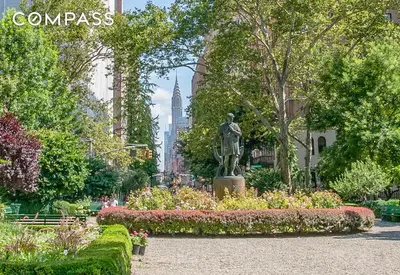
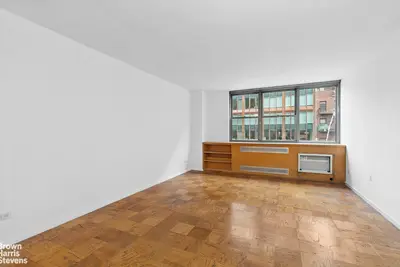
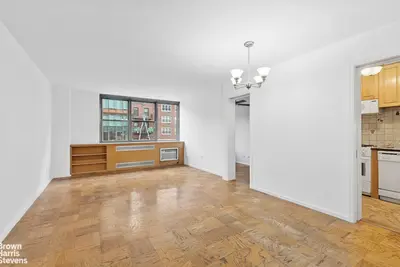
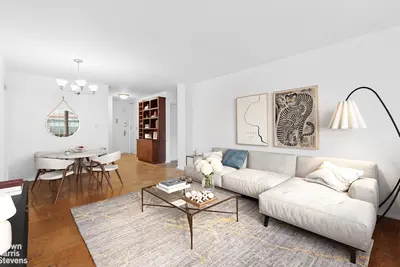
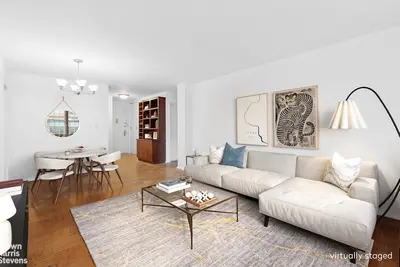
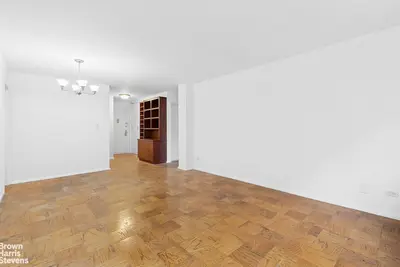
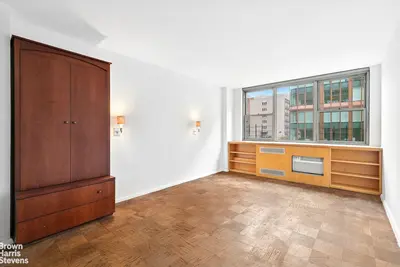
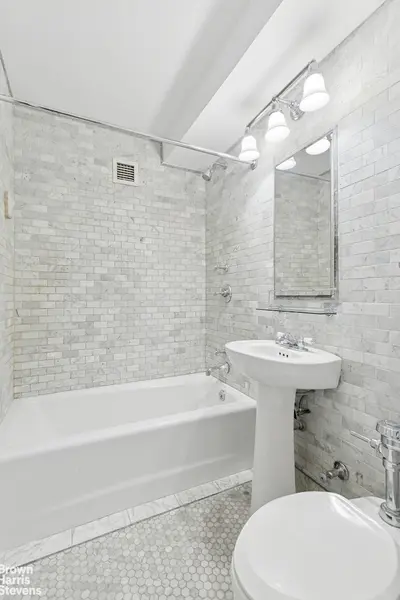
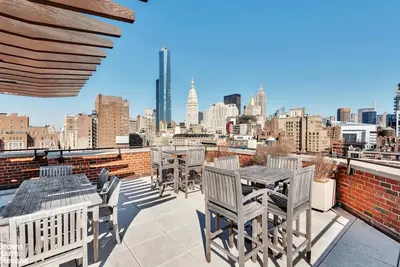
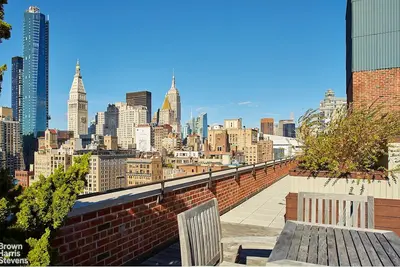
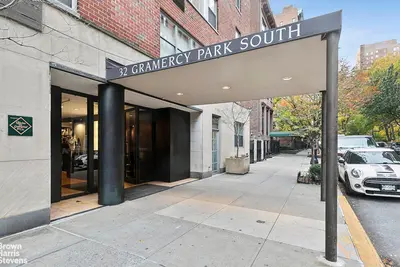
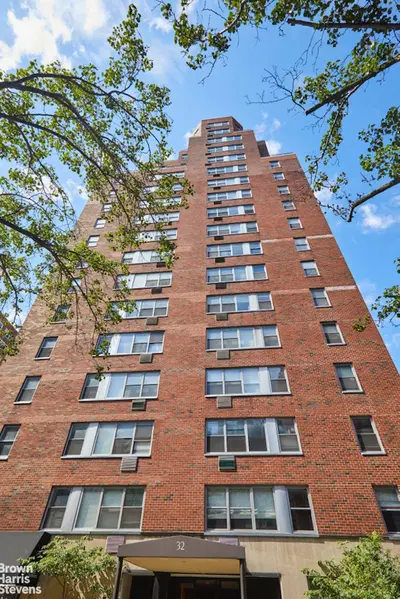
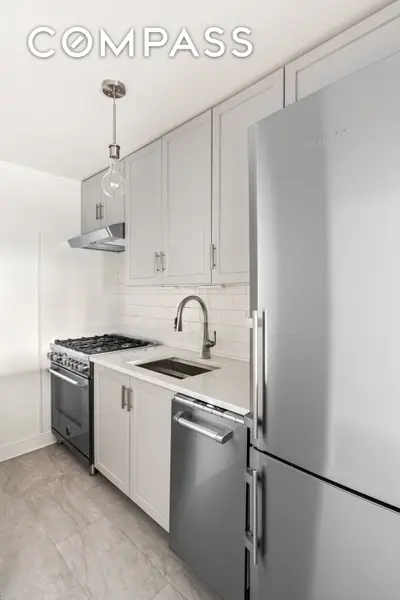
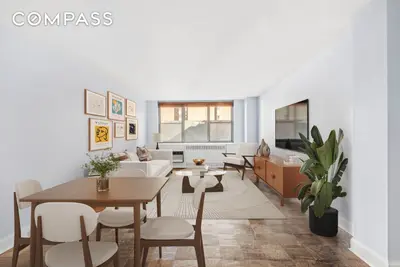
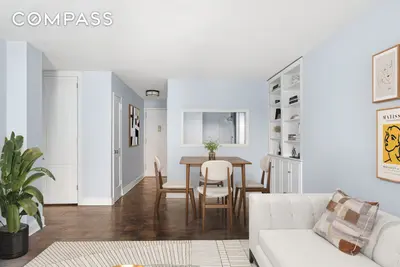
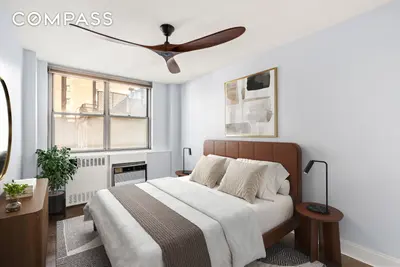
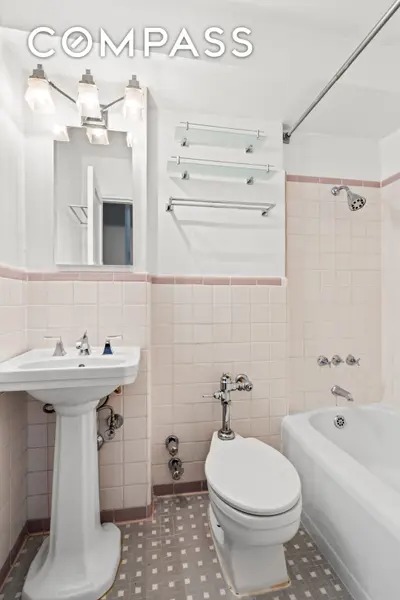
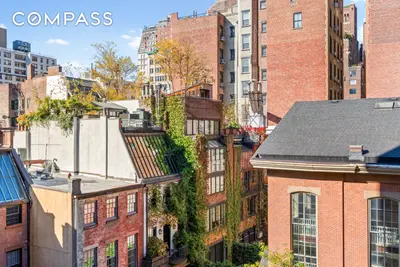
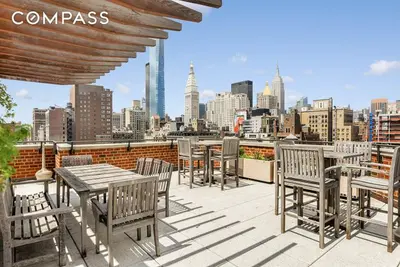
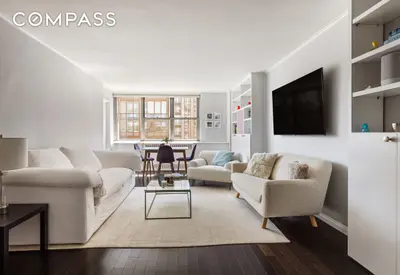
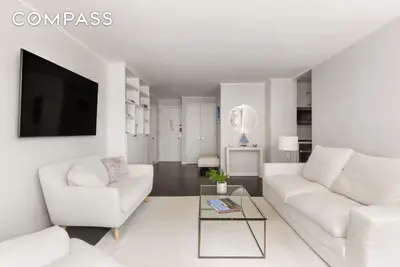
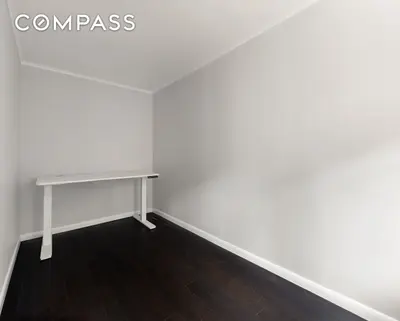
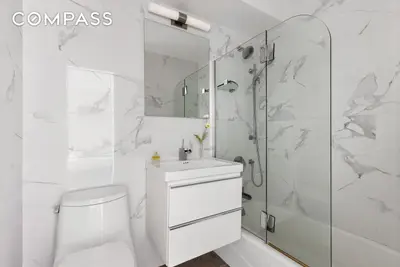

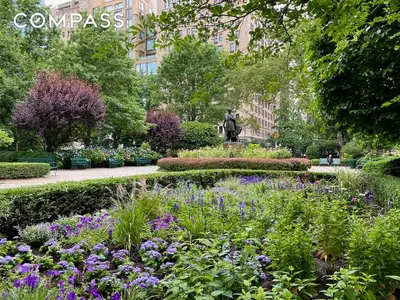
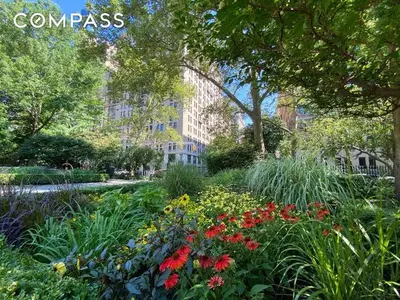

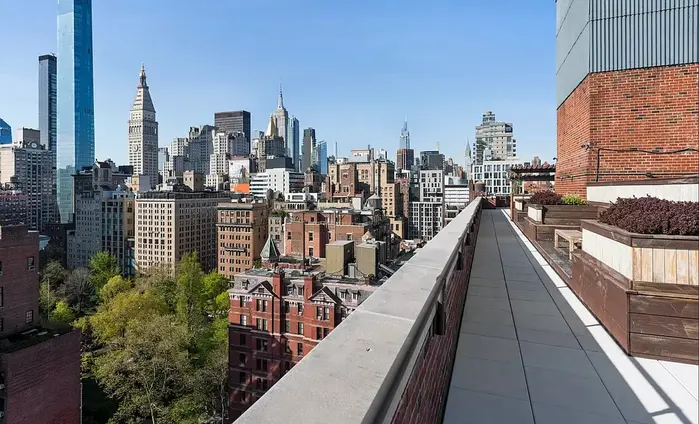
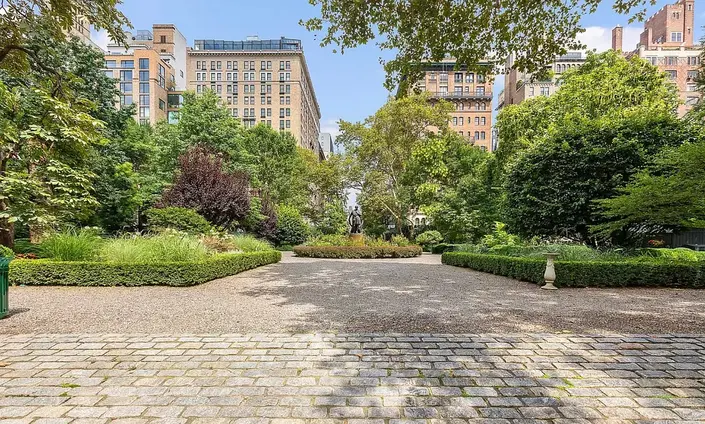
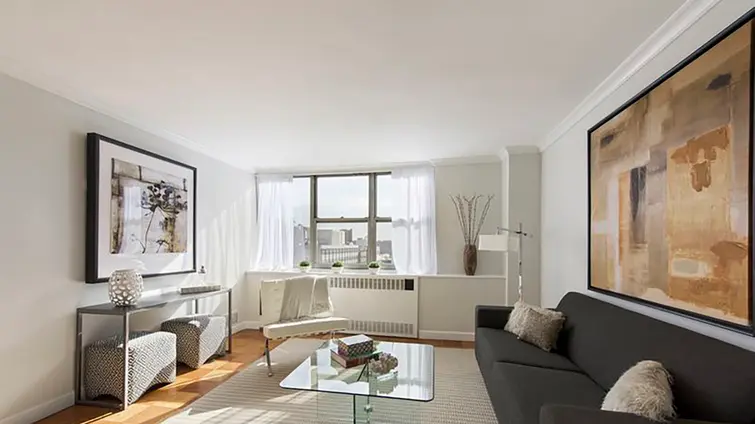
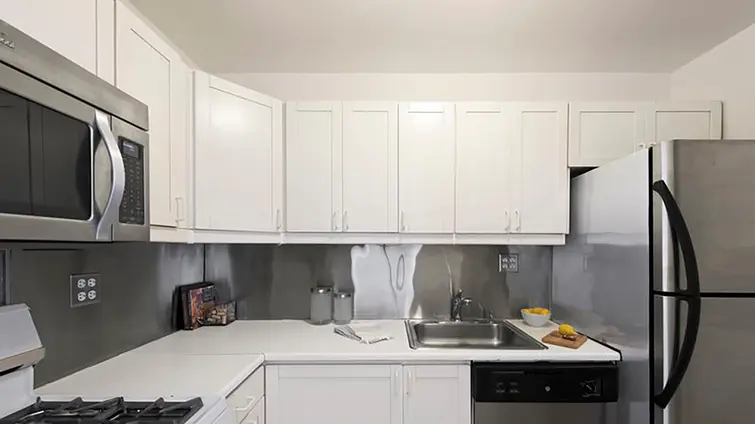
Gramercy Towers is an 18-story, 175-unit post-war cooperative completed in 1956 and located at 32 Gramercy Park South. Residential amenities include a laundry room, lushly landscaped roof terrace, and the only on-site garage on Gramercy Park. It is well situated near the Union Square transportation hub as well as the Greenmarket, Whole Foods, Trader Joe's, and fine dining, shopping, and nightlife. Pets and pied-a-terres are allowed.

View school info, local attractions, transportation options & more.
Experience amazing 3D aerial maps and fly throughs.
For some co-ops, instead of price per square foot, we use an estimate of the number of rooms for each sold apartment to chart price changes over time. This is because many co-op listings do not include square footage information, and this makes it challenging to calculate accurate square-foot averages.
By displaying the price per estimated room count, we are able to provide a more reliable and consistent metric for comparing sales in the building. While we hope that this gives you a clearer sense of price trends in the building, all data should be independently verified. All data provided are only estimates and should not be used to make any purchase or sale decision.
Broker & Buyer Comments