Sage House, 4 Lexington Avenue - Gramercy Park
- Apartments
- Overview & Photos
- Maps
- Floorplans
- Sales Data & Comps
- Similar Buildings
- All Units
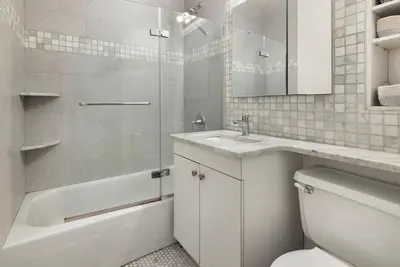
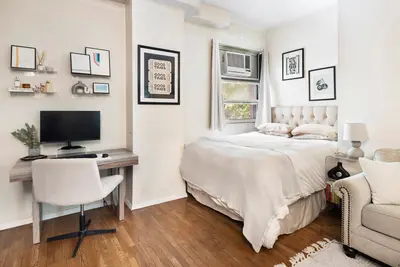
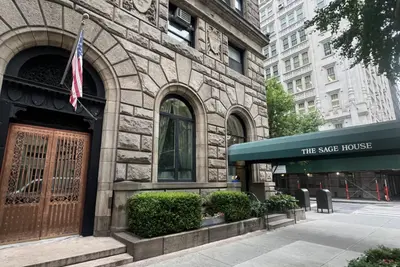
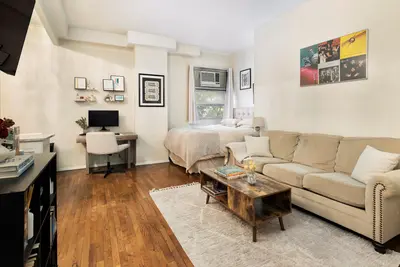
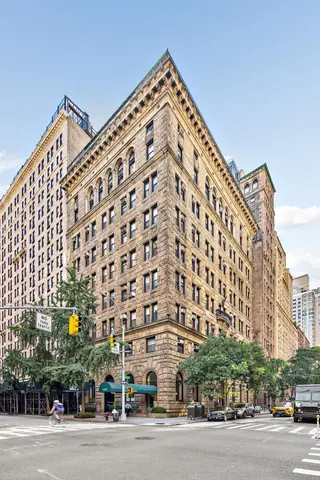
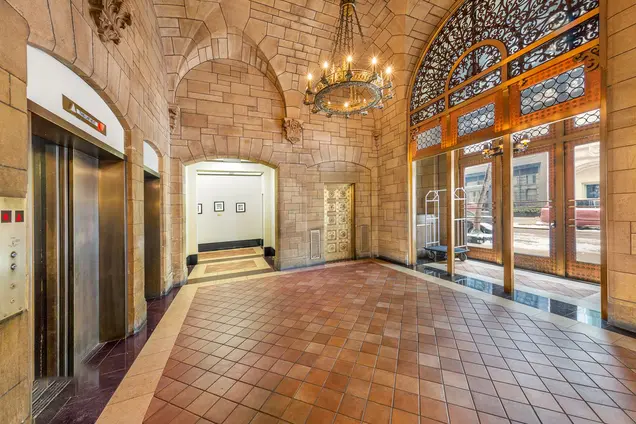
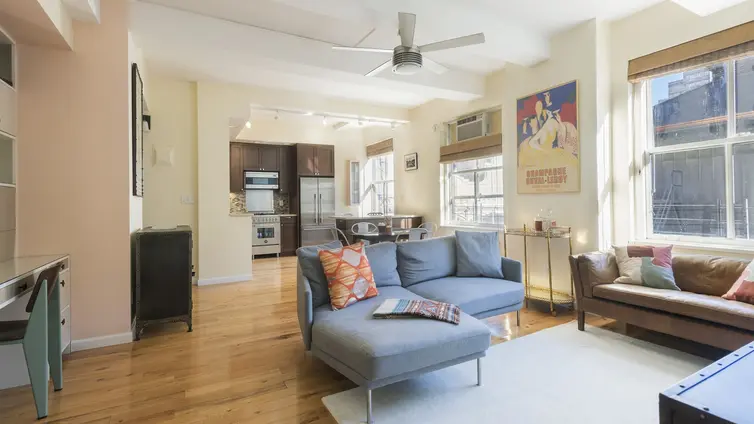
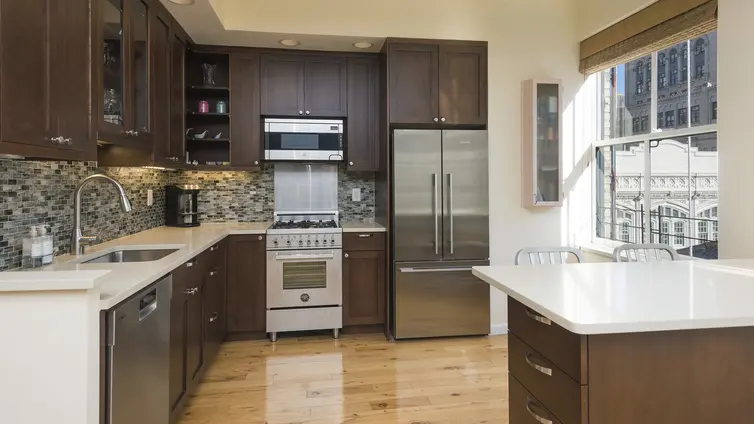
Sage House was built in 1913 for the Russell Sage Foundation, a social welfare nonprofit that was an early advocate of social work and urban planning. Renowned architect Grosvenor Atterbury designed the building in the style of a Florentine Renaissance palazzo and included vaulted ceilings with a rough-cut red sandstone faade with carved decorative shields. It was converted to residential use in 1975, and residents have access to a 24-hour doorman, live-in resident manager, laundry room, bike room, and storage. The building is pet-friendly, allows up to 80% financing, and permits pied-a-terres and gifting. The building also has a liberal subletting policy available after 1 year of ownership with board approval.
Sage House is located at 4 Lexington Avenue near fine dining, the Gramercy Park Hotel, Union Square Park, Madison Square Park, and the transportation options near each.

View school info, local attractions, transportation options & more.
Experience amazing 3D aerial maps and fly throughs.
For some co-ops, instead of price per square foot, we use an estimate of the number of rooms for each sold apartment to chart price changes over time. This is because many co-op listings do not include square footage information, and this makes it challenging to calculate accurate square-foot averages.
By displaying the price per estimated room count, we are able to provide a more reliable and consistent metric for comparing sales in the building. While we hope that this gives you a clearer sense of price trends in the building, all data should be independently verified. All data provided are only estimates and should not be used to make any purchase or sale decision.
Broker & Buyer Comments