200 Mercer Street - Greenwich Village
- Apartments
- Overview & Photos
- Maps
- Floorplans
- Sales Data & Comps
- Similar Buildings
- All Units

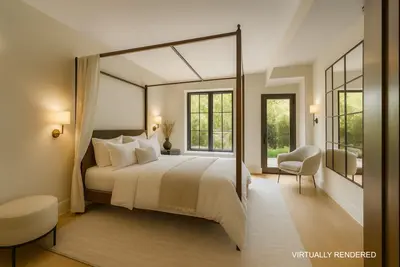
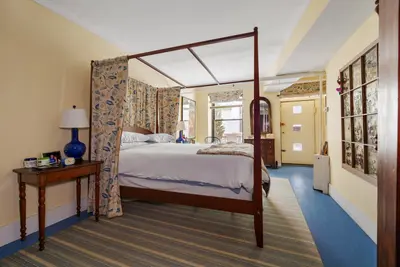
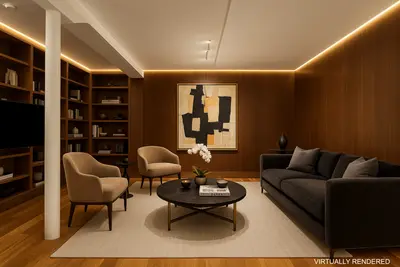
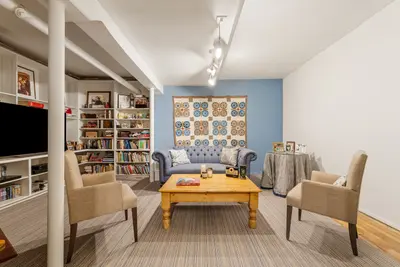
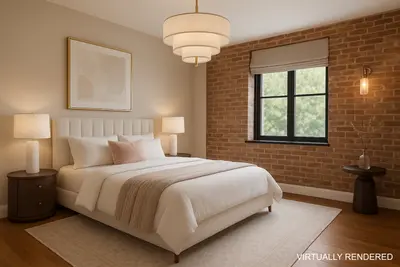
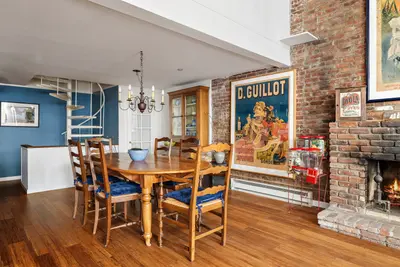
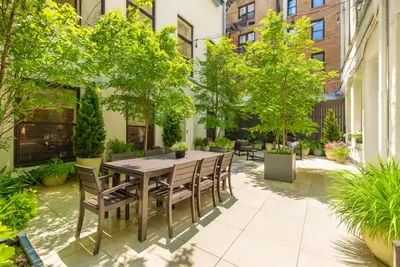
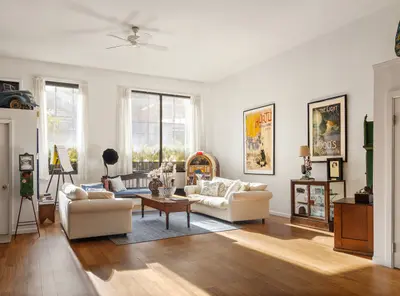

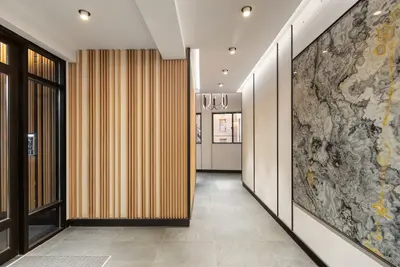
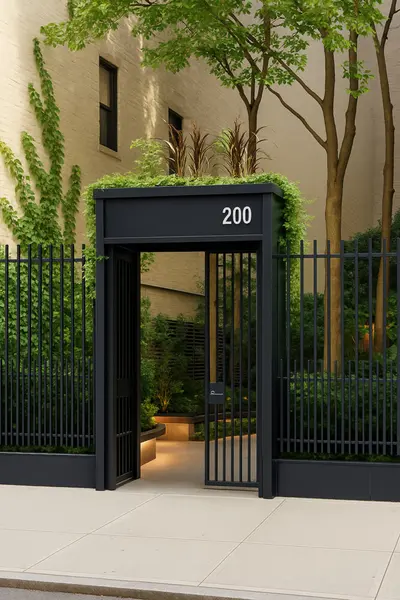
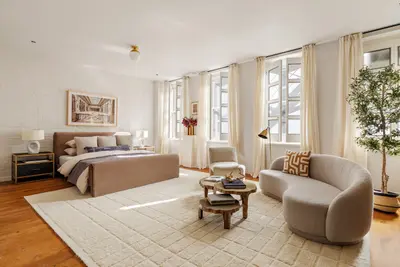

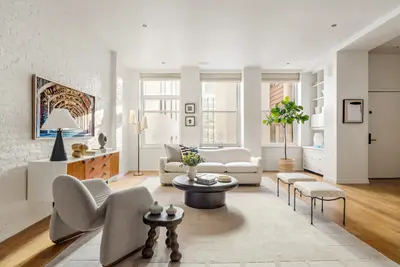
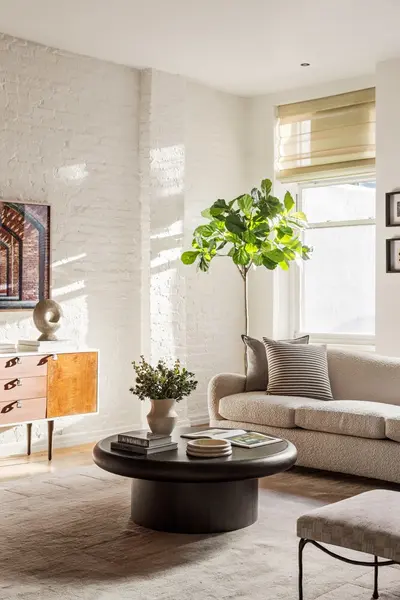
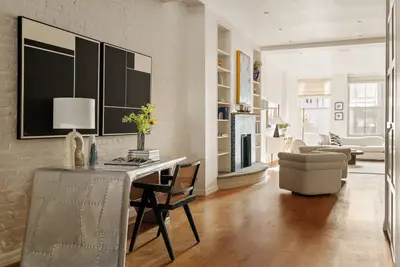
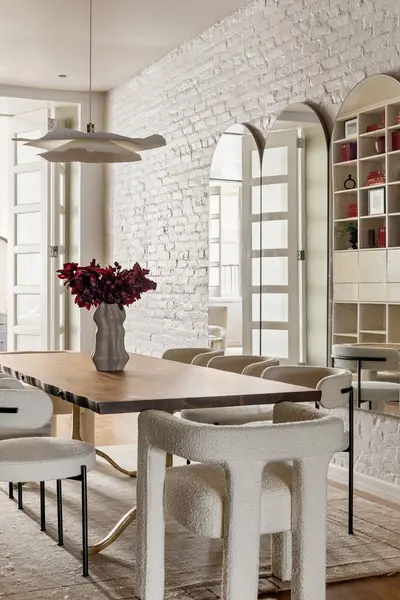
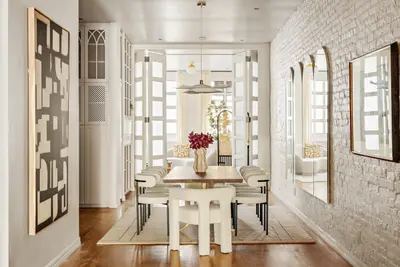
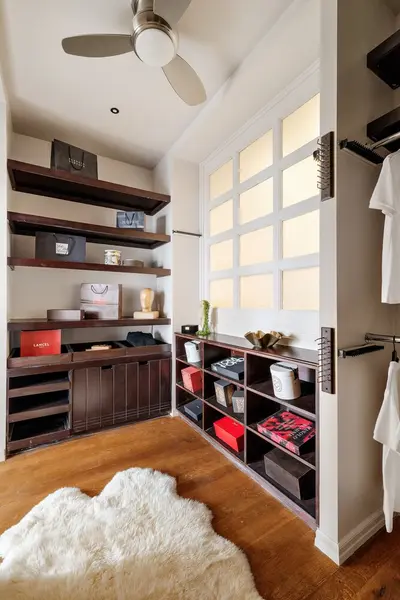
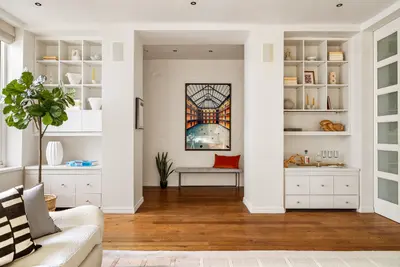
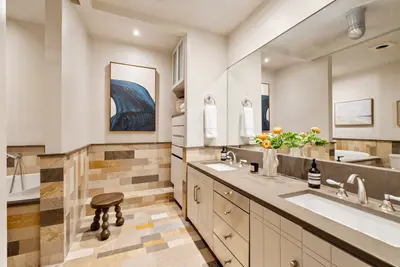
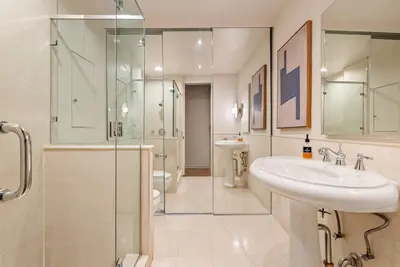


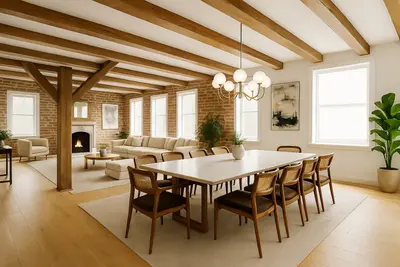
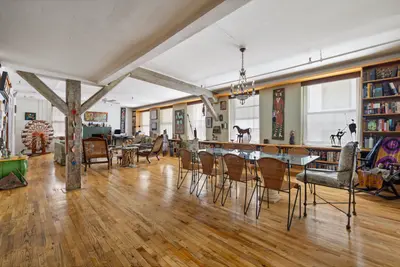

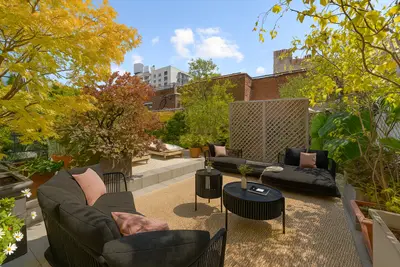
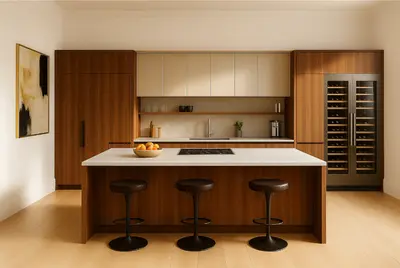
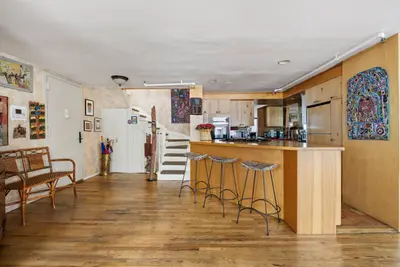

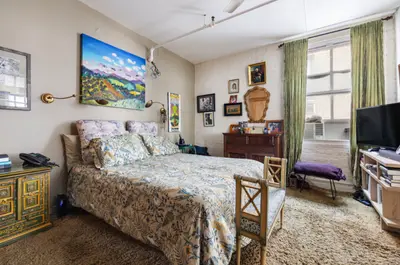
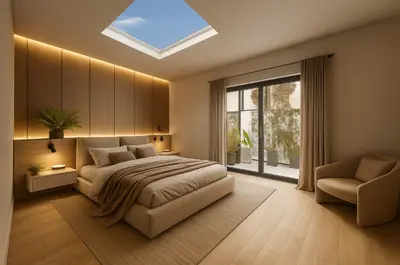
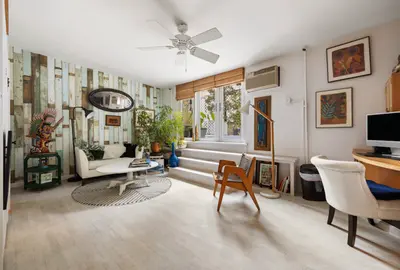
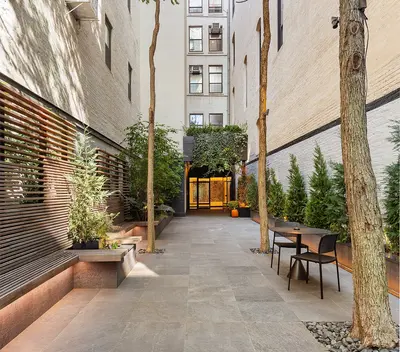


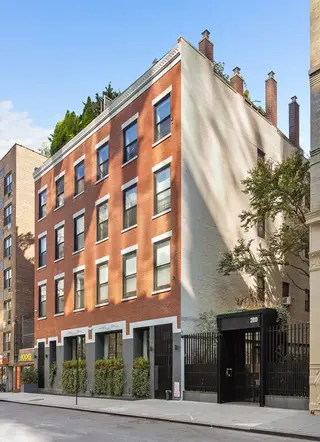
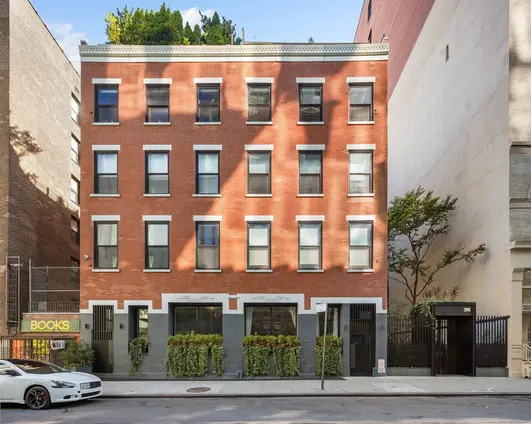
Tucked along a quiet stretch of Mercer Street in NoHo, 200 Mercer is a rare co-op that fuses deep history with enviable convenience. Originally built in 1854 as a stable for industrialist Peter Goelet and designed by architect John G. Prague, the red-brick structure is one of the area’s oldest surviving buildings. In the 1980s, it was thoughtfully converted into a 28-unit cooperative by merging it with three adjacent buildings on Broadway, all centered around a gated courtyard. Today, it sits just moments from Washington Square Park, SoHo, the West Village, and some of downtown’s best dining and shopping.
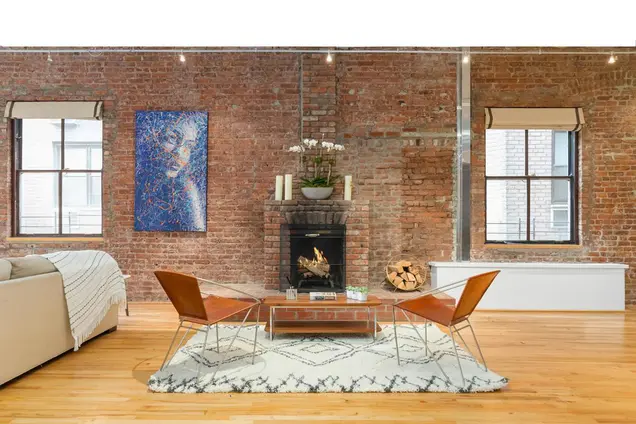
Inside, the boutique elevator building features newly refreshed common areas, a video intercom, and daily support from a live-in super and porter. Residents also enjoy unique flexibility: washer/dryers are permitted in-unit, “wet-over-dry” layouts are allowed (a rare perk for renovators), and pieds-à-terre, pets, and purchases by LLCs are welcome with board approval. Across the street, NYU’s half-Olympic-sized pool is available by membership—offering a truly local luxury. Though the building does not have a doorman, its location on a wide, tree-lined block with Citi Bike stations and multiple subway lines nearby makes daily life both elegant and efficient.


View school info, local attractions, transportation options & more.
Experience amazing 3D aerial maps and fly throughs.
For some co-ops, instead of price per square foot, we use an estimate of the number of rooms for each sold apartment to chart price changes over time. This is because many co-op listings do not include square footage information, and this makes it challenging to calculate accurate square-foot averages.
By displaying the price per estimated room count, we are able to provide a more reliable and consistent metric for comparing sales in the building. While we hope that this gives you a clearer sense of price trends in the building, all data should be independently verified. All data provided are only estimates and should not be used to make any purchase or sale decision.