69 West 9th Street - Greenwich Village
- Apartments
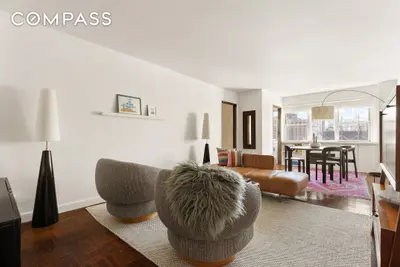
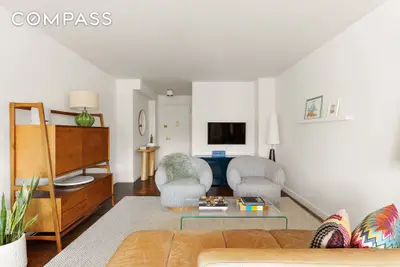
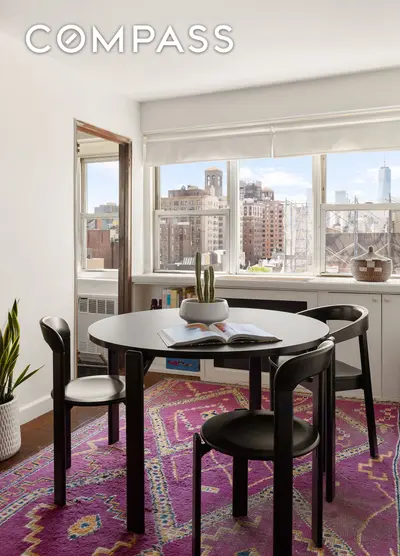
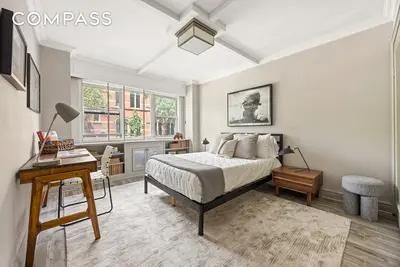
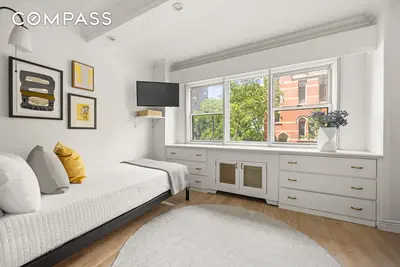
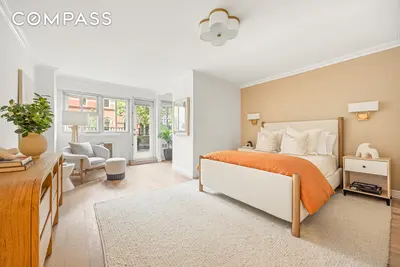
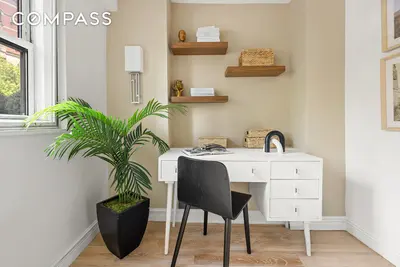
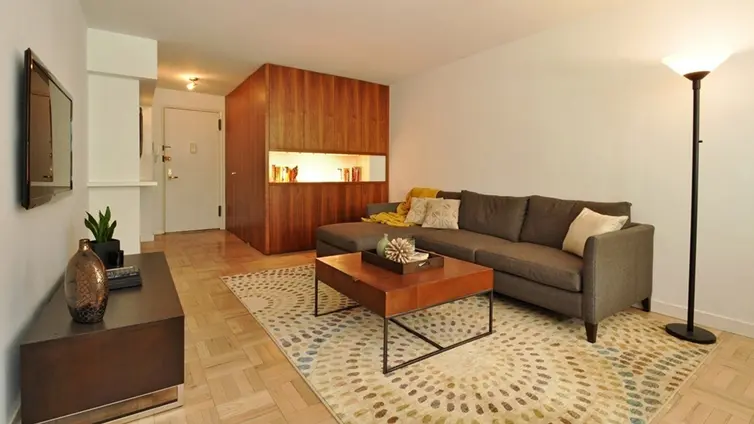
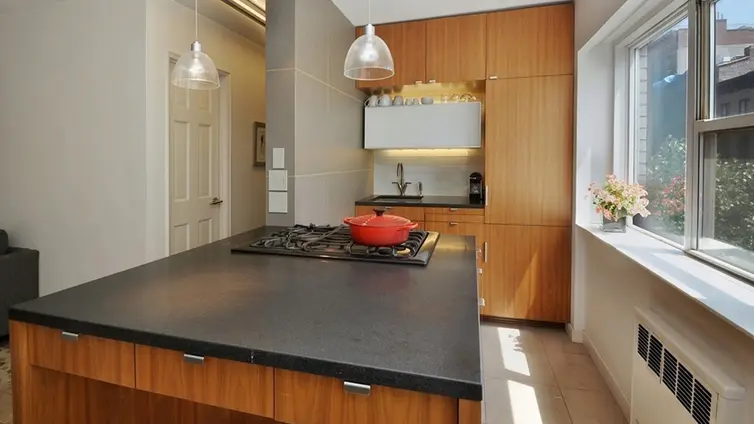
- Overview & Photos
- Maps
- Floorplans
- Sales Data & Comps
- Similar Buildings
- All Units
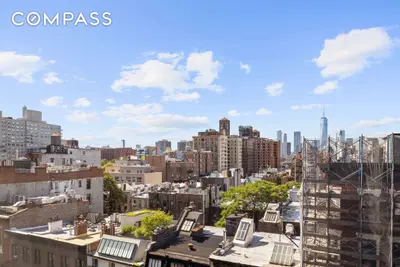
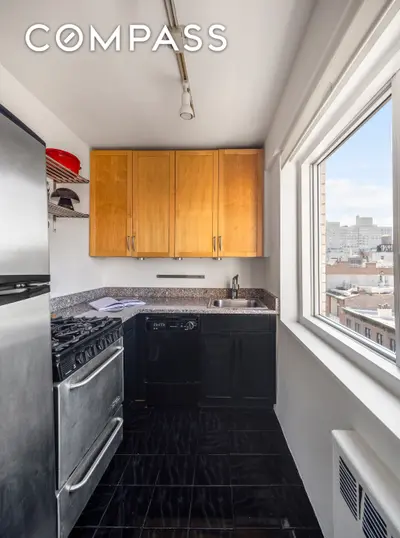
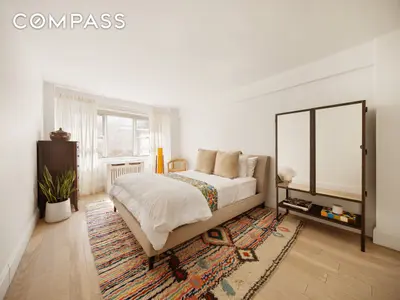
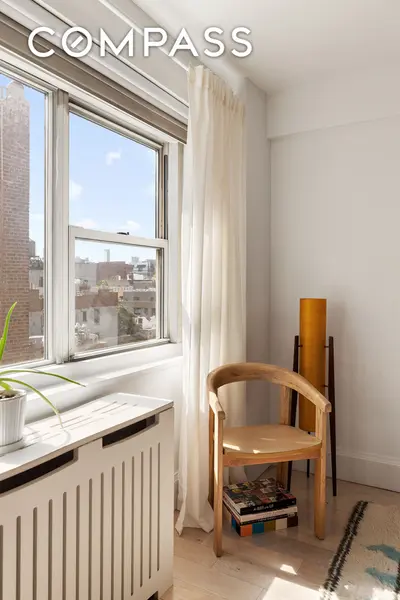
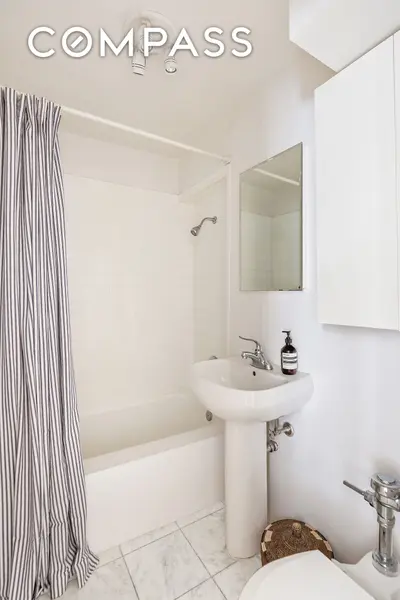
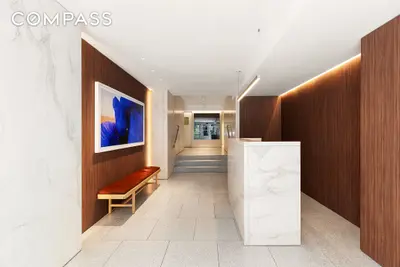
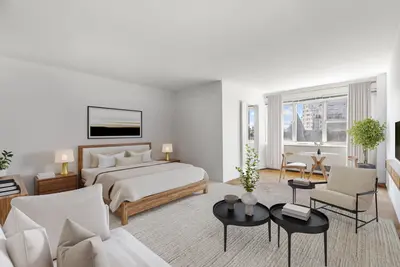
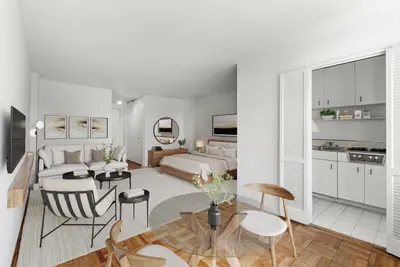
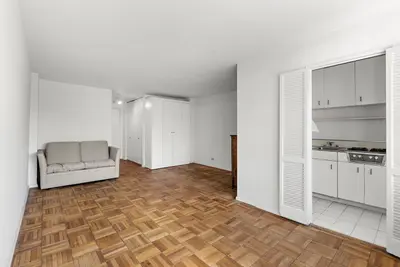
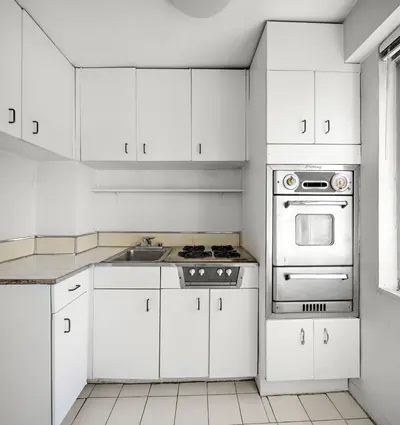
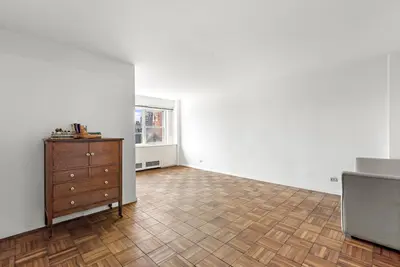
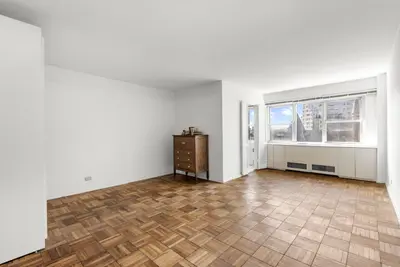
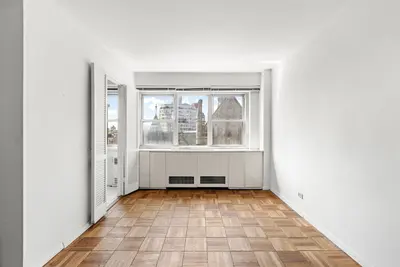
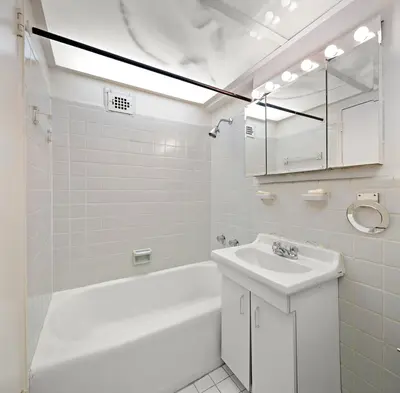
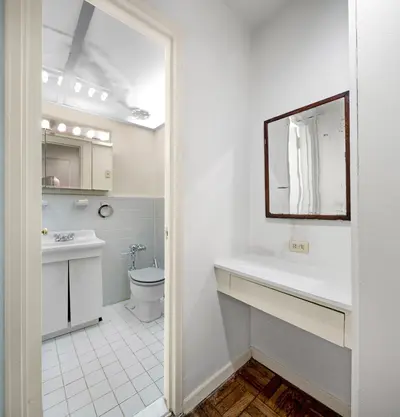
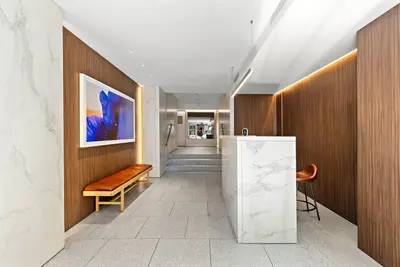
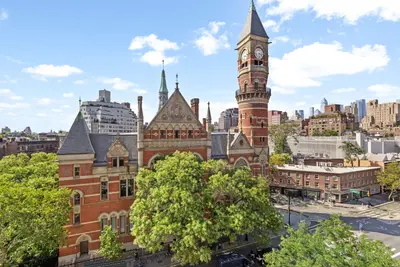
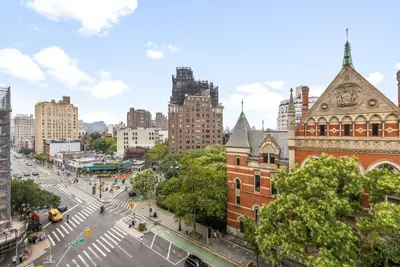
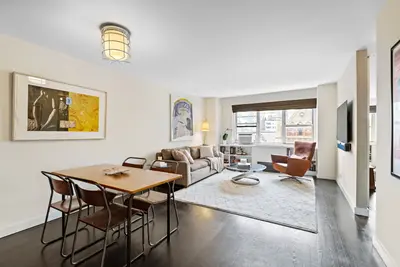
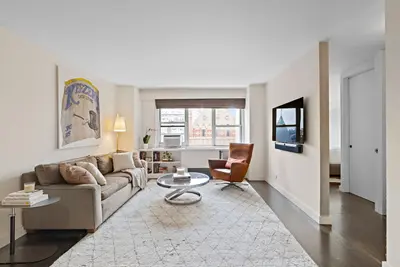
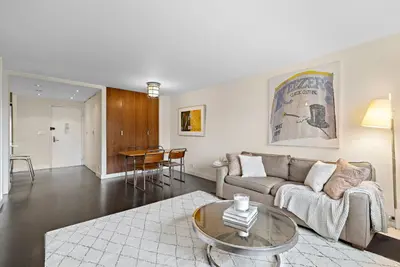
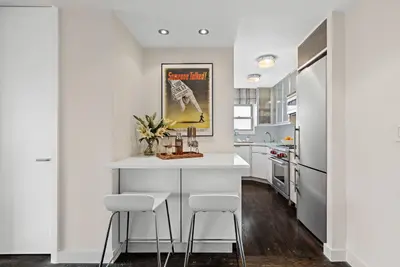
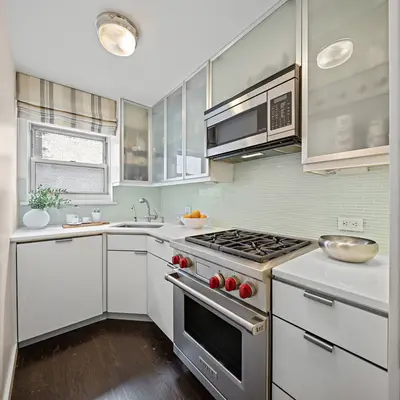
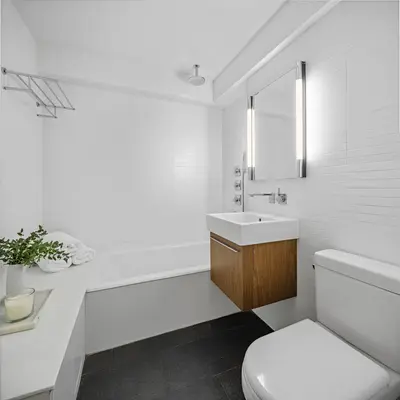
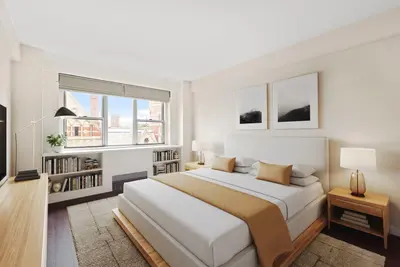
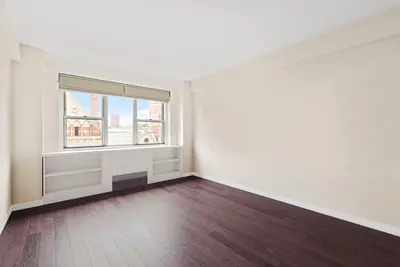
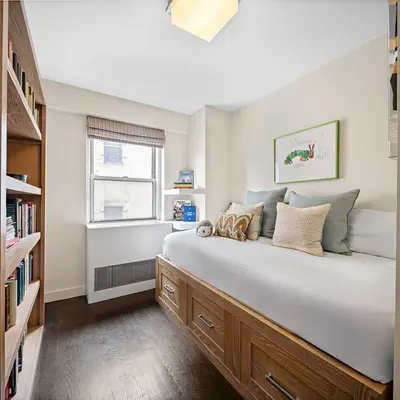
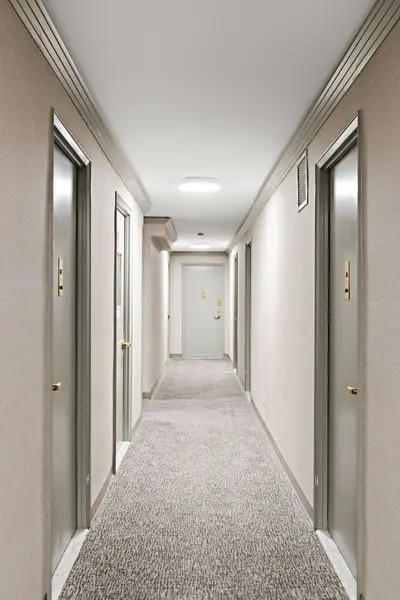
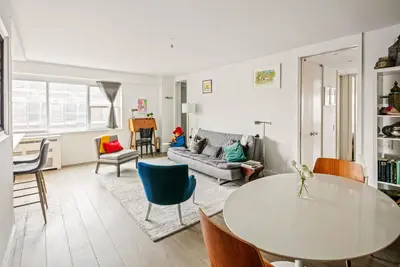
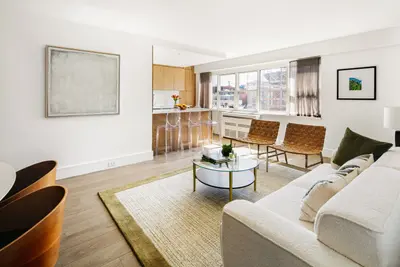
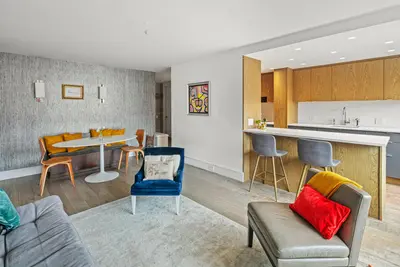
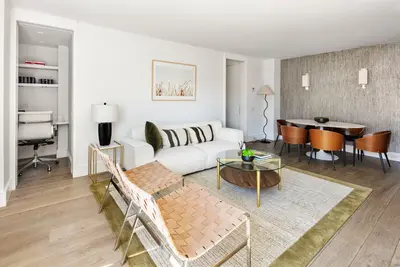
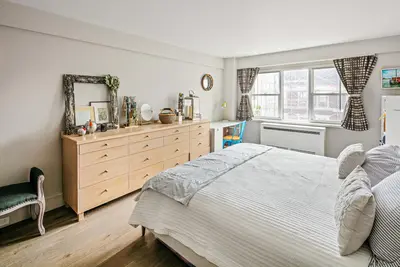
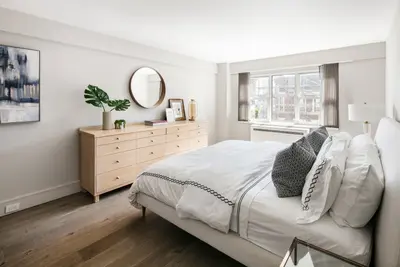
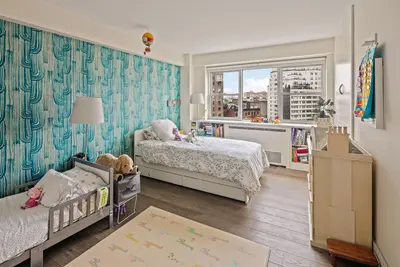
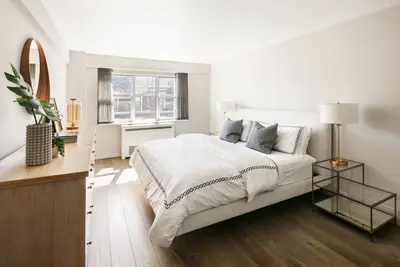
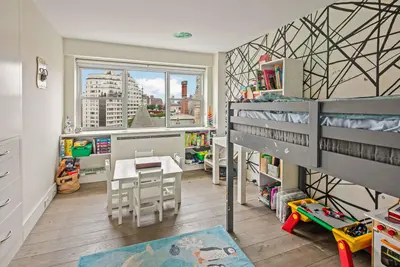
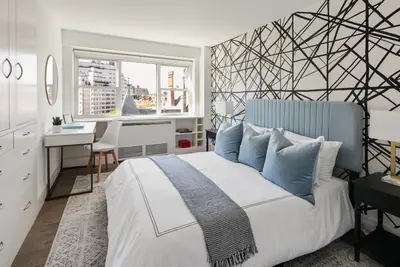
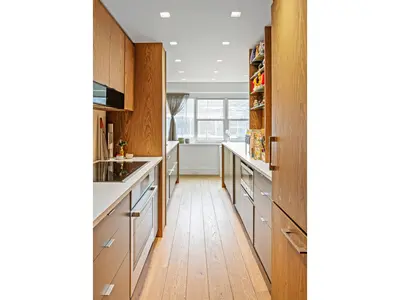
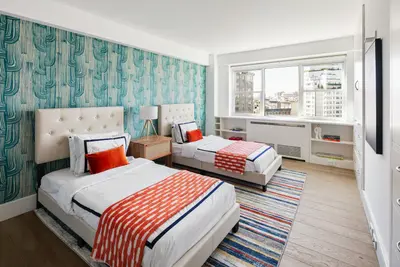
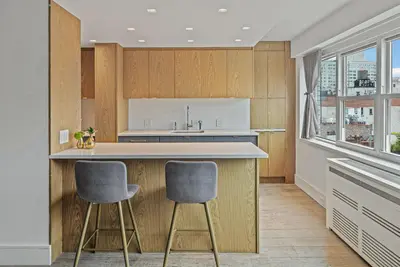
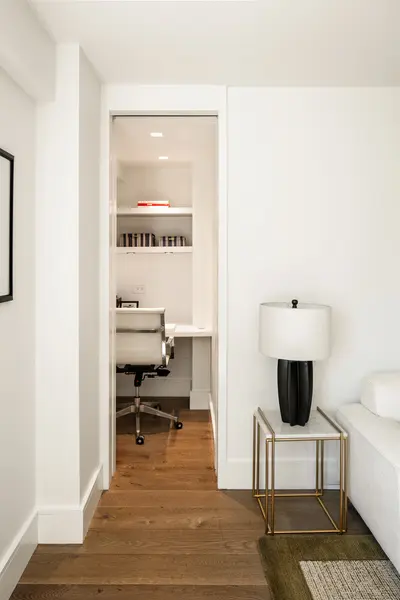
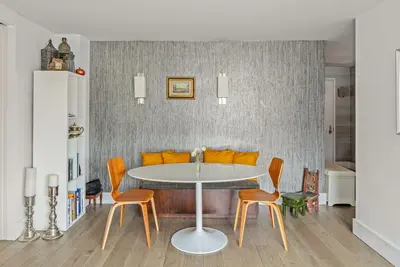
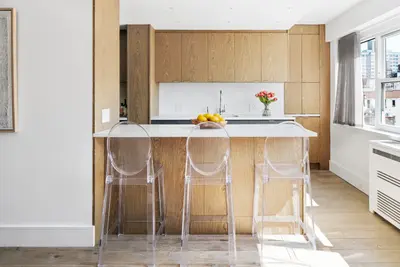
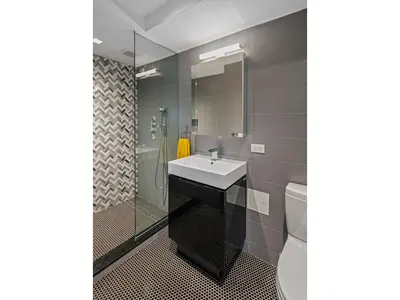
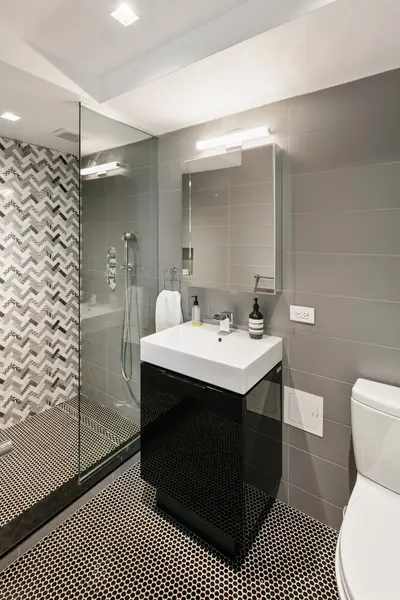
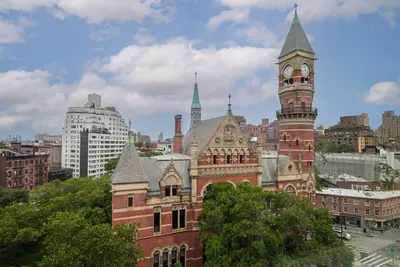
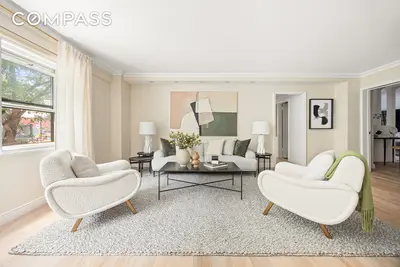
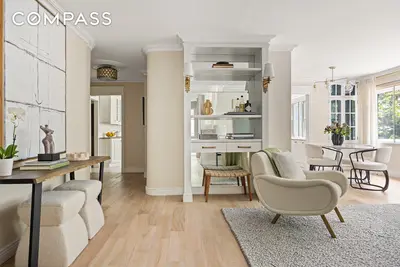


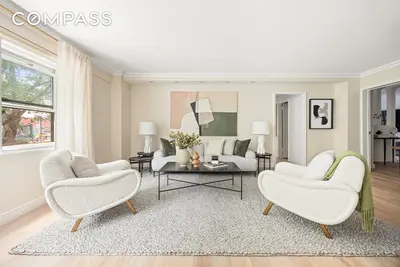

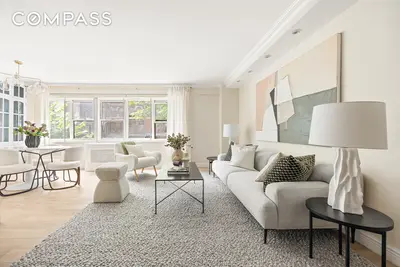


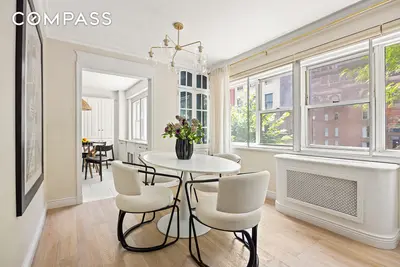
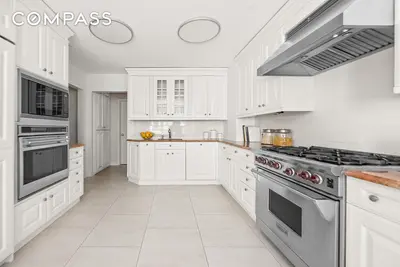
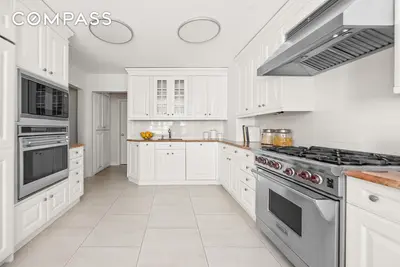

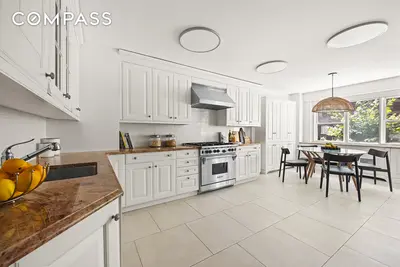


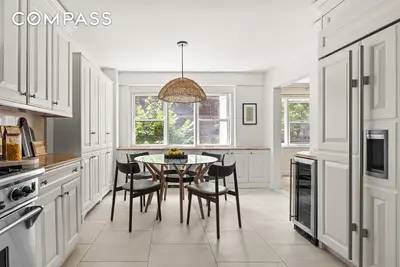

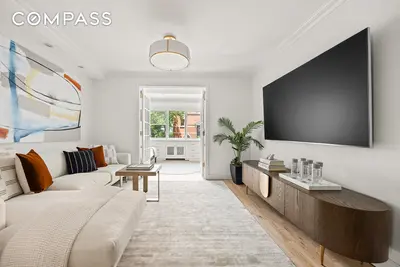


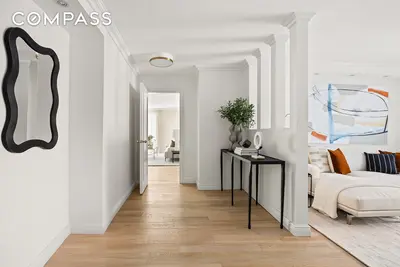


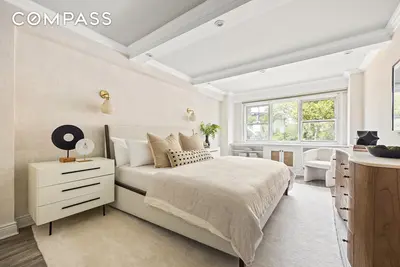


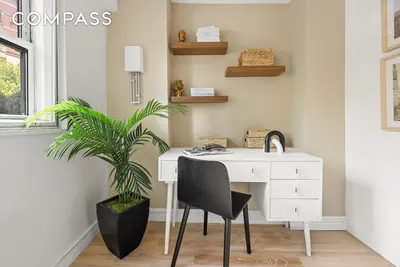


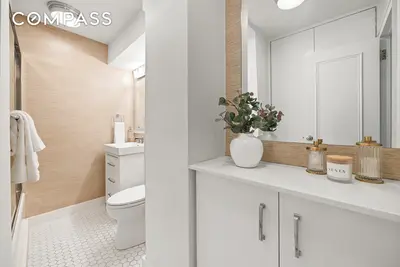
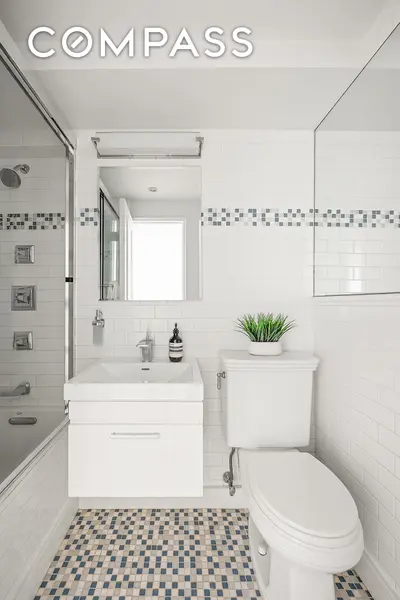


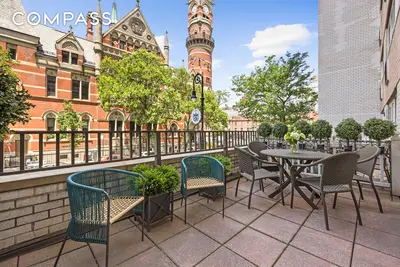
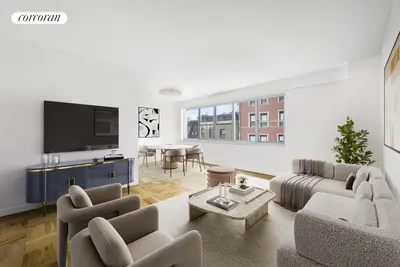
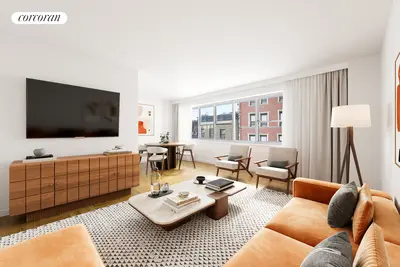
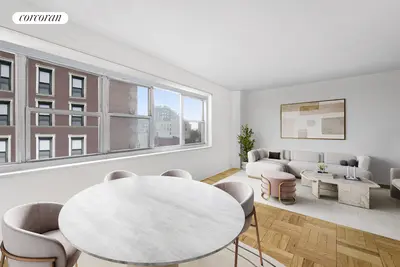

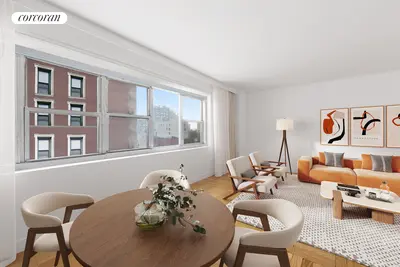
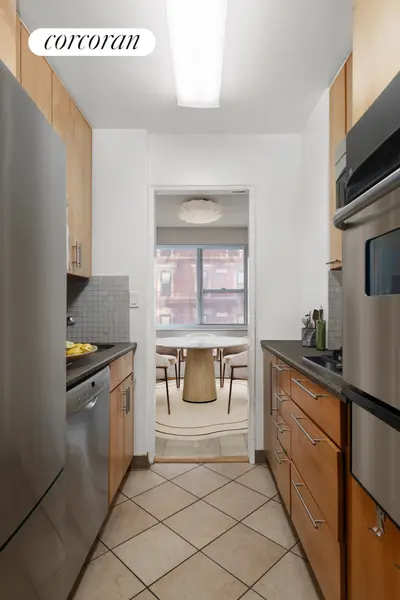


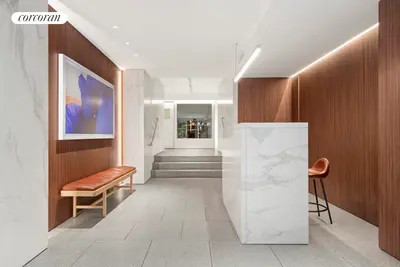
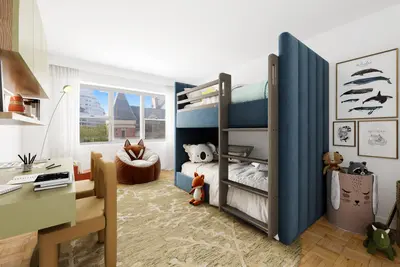
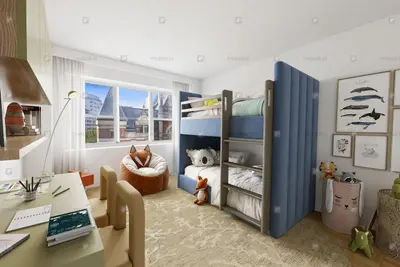
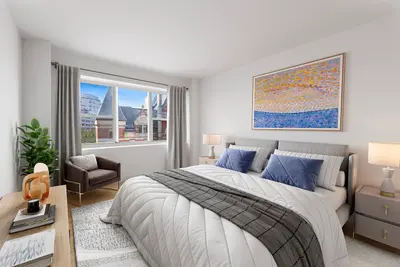
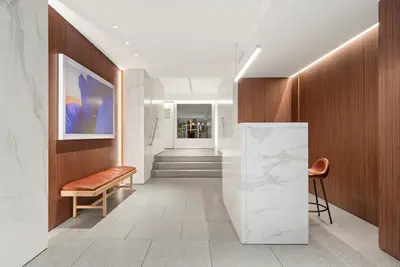
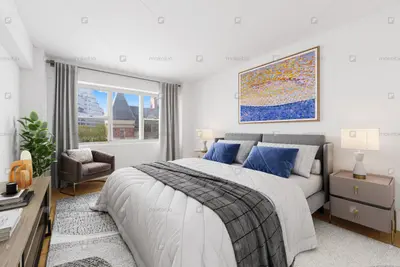

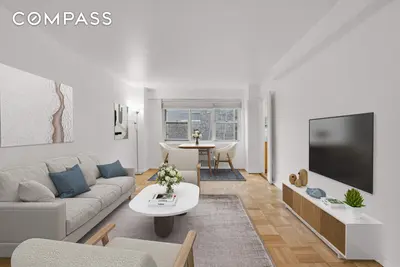
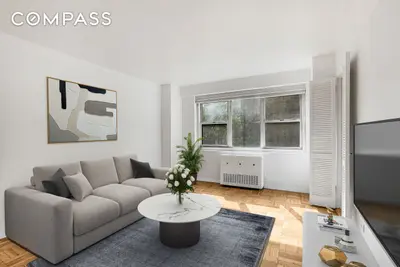

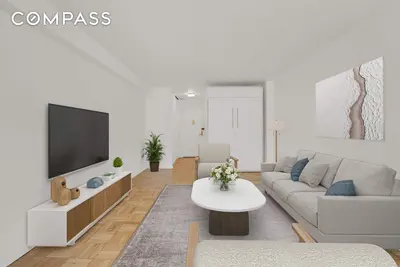
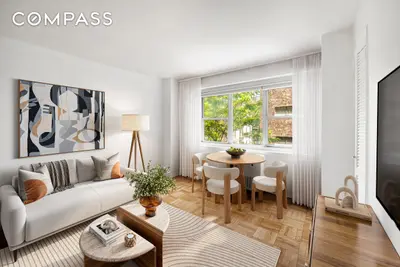
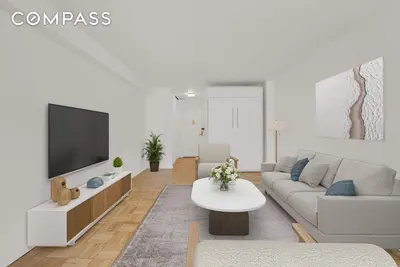

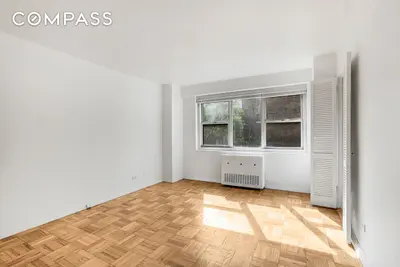
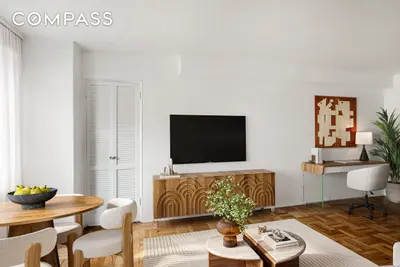
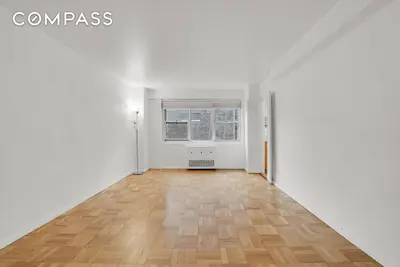
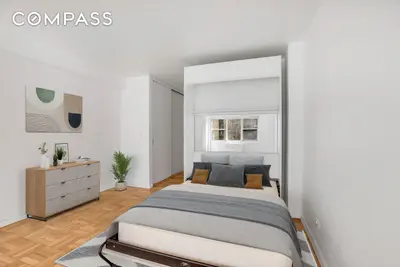
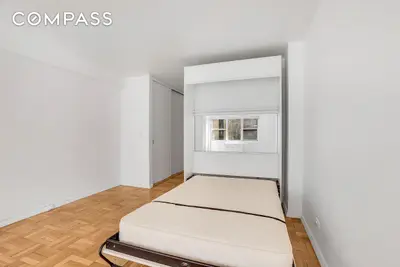

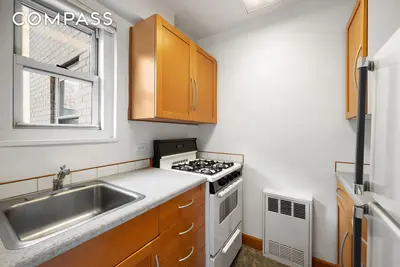
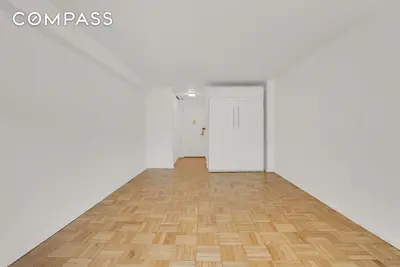
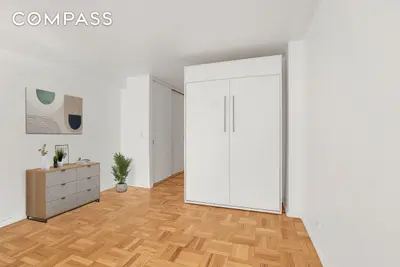


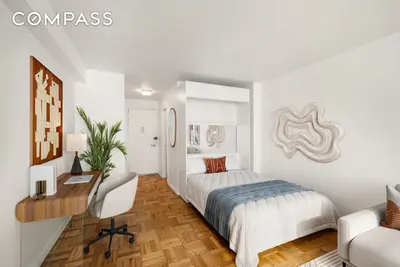
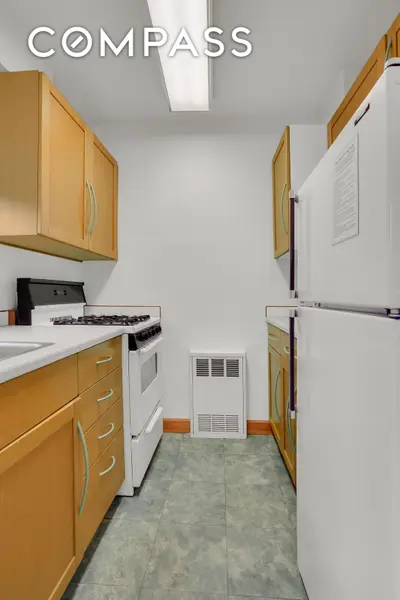
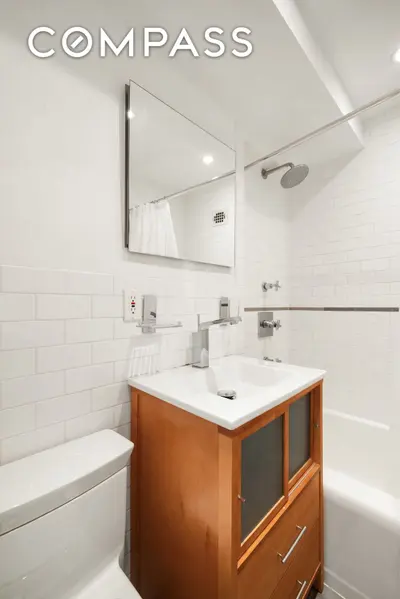
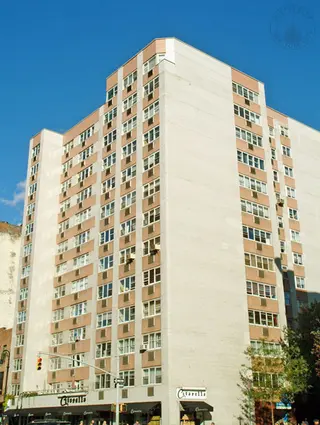
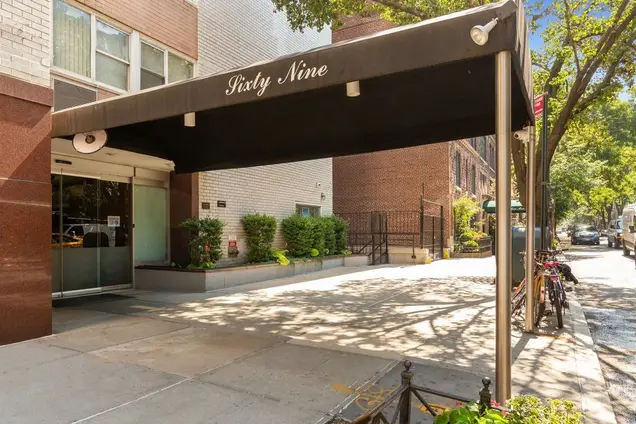
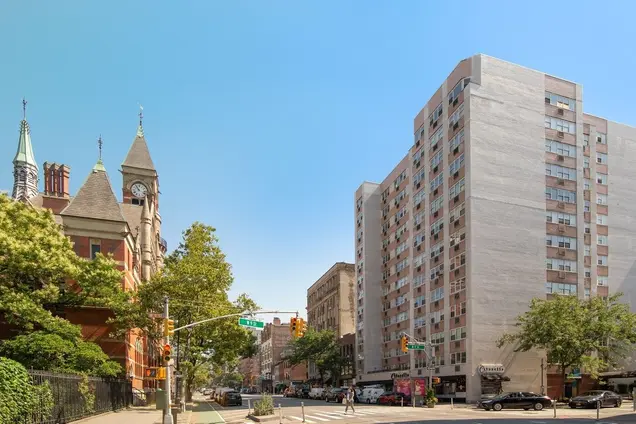
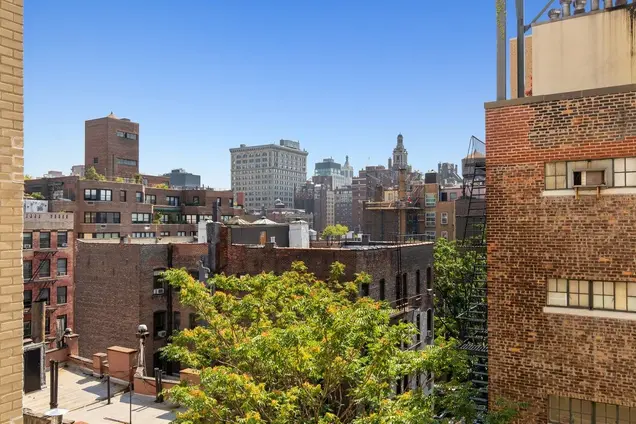
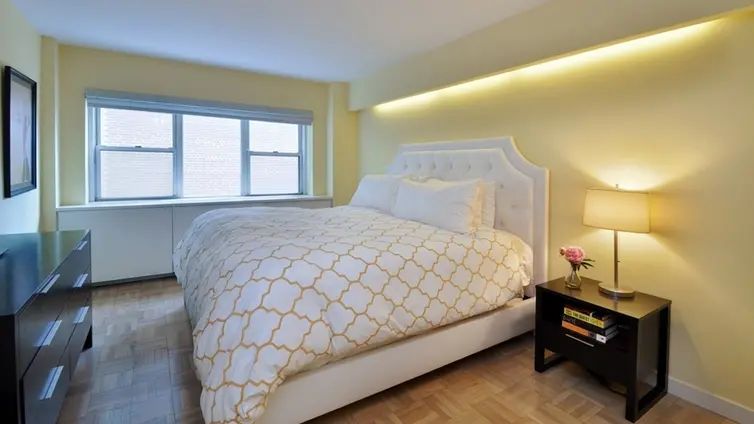
69 West 9th Street is a 13-story postwar building completed in 1957 and converted to a 119-unit cooperative in 1985. The building is pet-friendly and staffed by a 24-hour doorman and concierge. There is also a garage, but it is close to the A/C/E, B/D/F/M, 1, and PATH trains for an easy commute anywhere. It is well situated in the heart of Greenwich Village near Citarella Market, the Jefferson Library, Washington Square Park and many of Manhattan's finest restaurants.

View school info, local attractions, transportation options & more.
Experience amazing 3D aerial maps and fly throughs.
For some co-ops, instead of price per square foot, we use an estimate of the number of rooms for each sold apartment to chart price changes over time. This is because many co-op listings do not include square footage information, and this makes it challenging to calculate accurate square-foot averages.
By displaying the price per estimated room count, we are able to provide a more reliable and consistent metric for comparing sales in the building. While we hope that this gives you a clearer sense of price trends in the building, all data should be independently verified. All data provided are only estimates and should not be used to make any purchase or sale decision.