The Albert, 23 East 10th Street - Greenwich Village
- Apartments
- Overview & Photos
- Maps
- Floorplans
- Sales Data & Comps
- Similar Buildings
- All Units


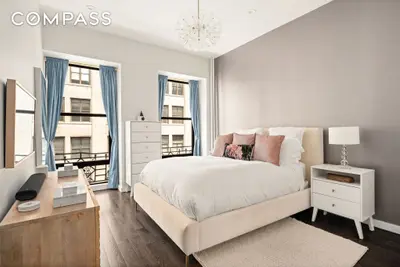
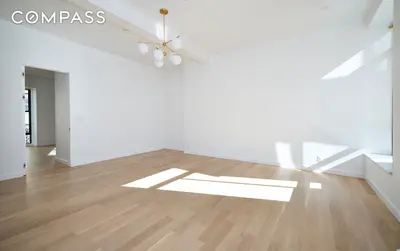
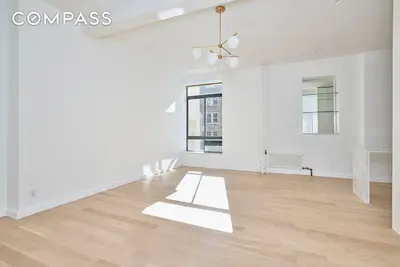
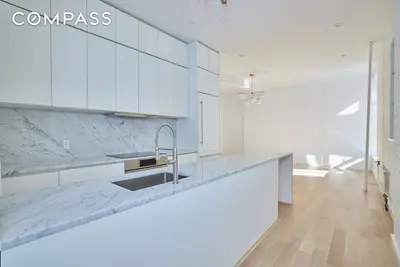
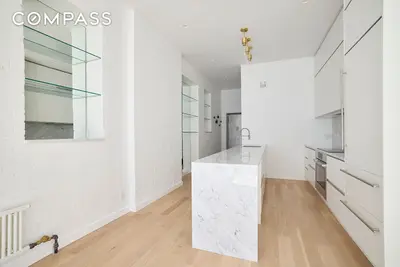
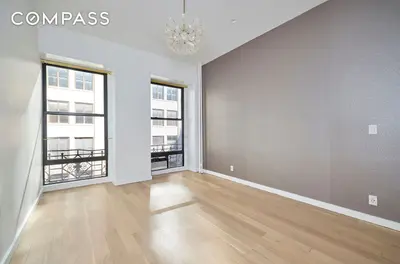
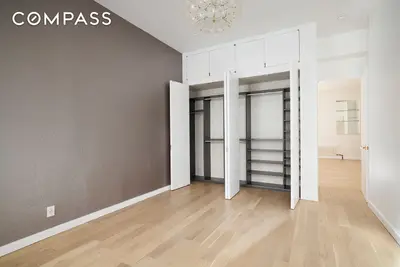
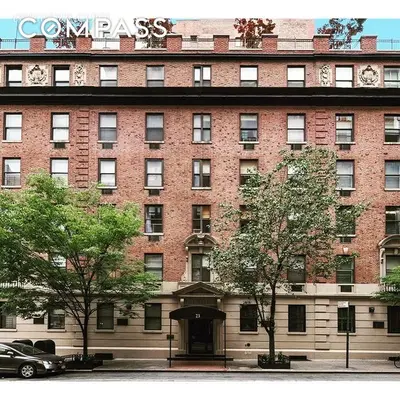
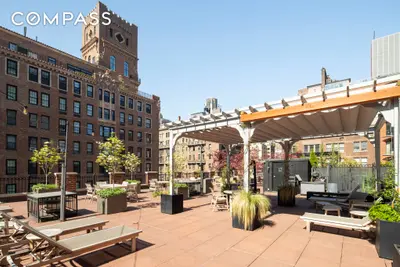
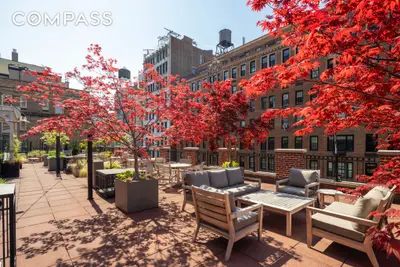
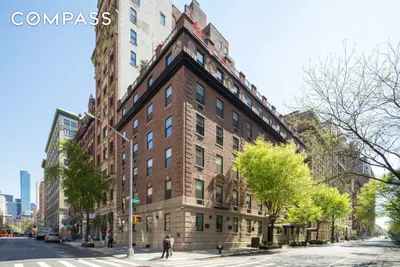
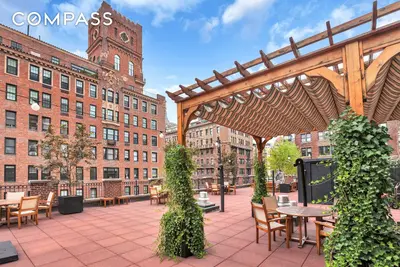
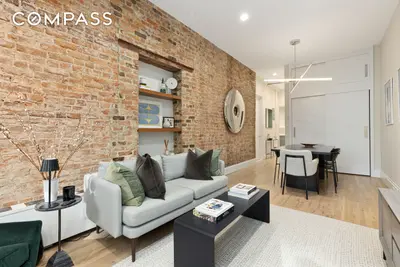
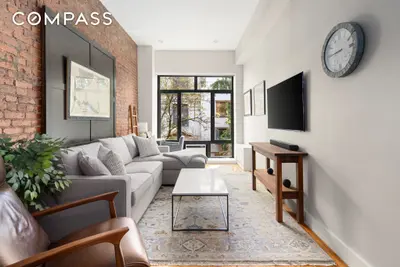
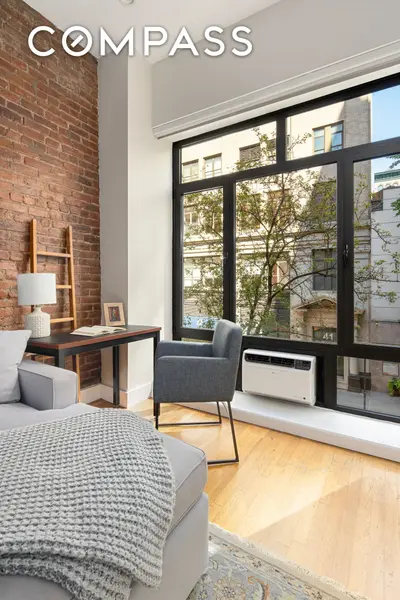
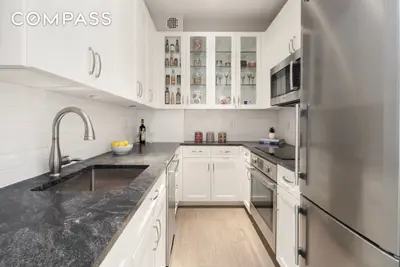
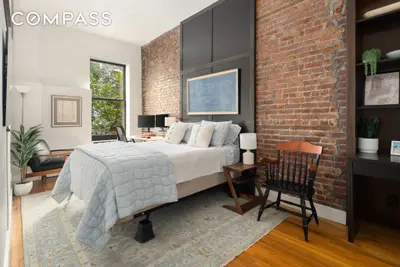

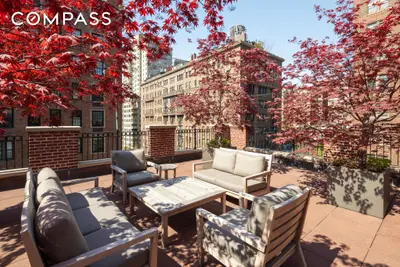
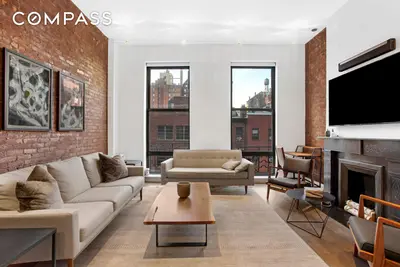
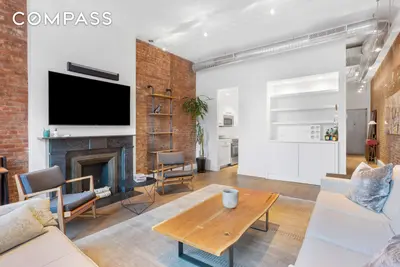
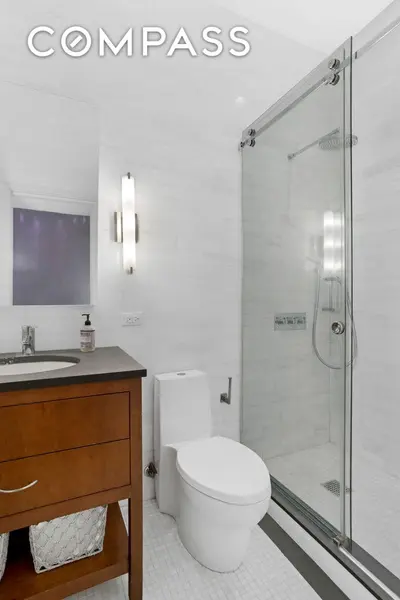
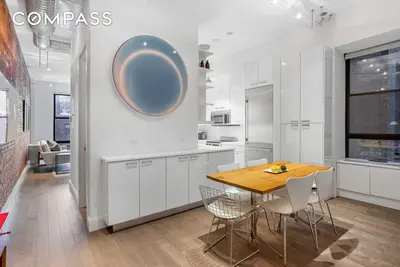
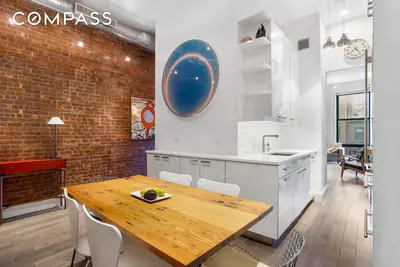
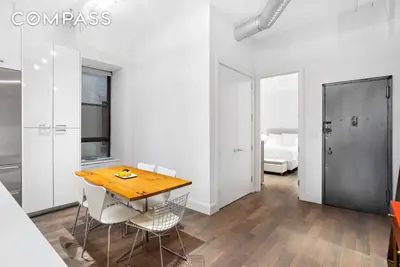
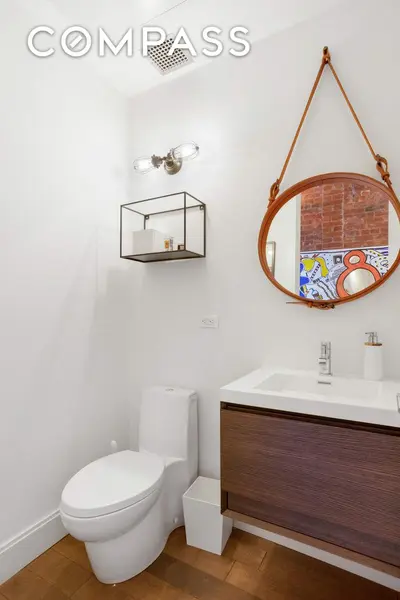
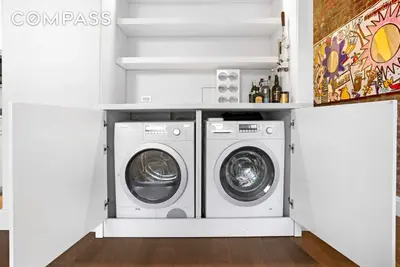
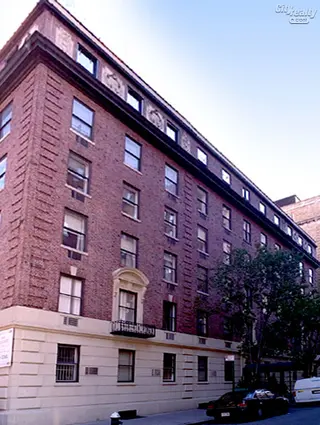
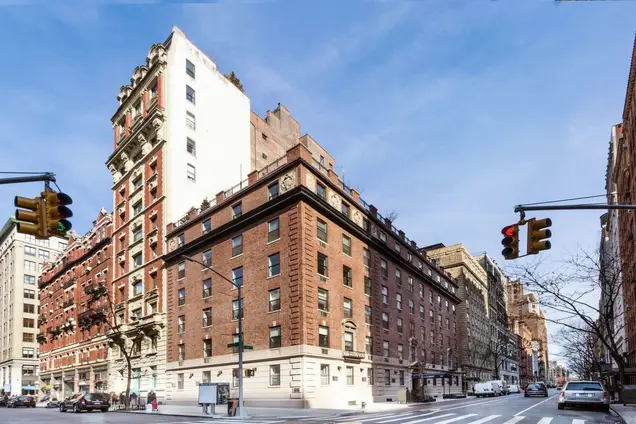
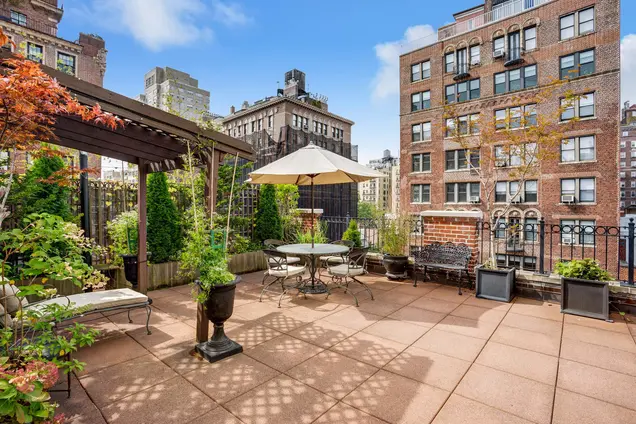
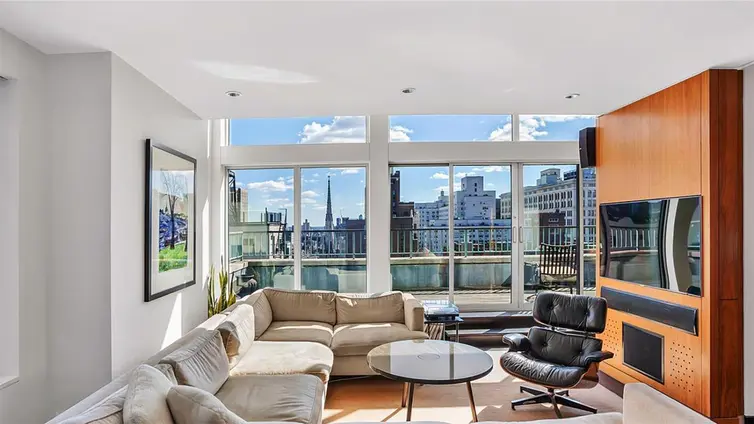
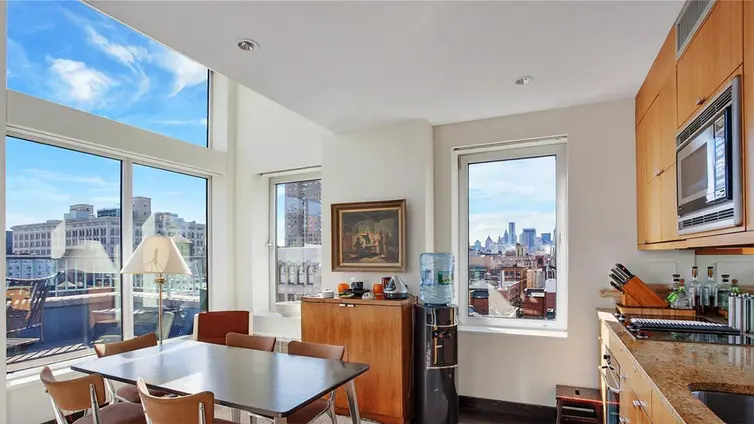
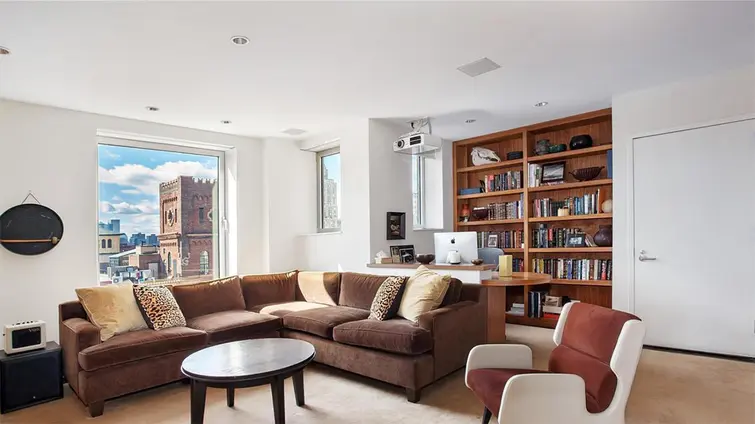
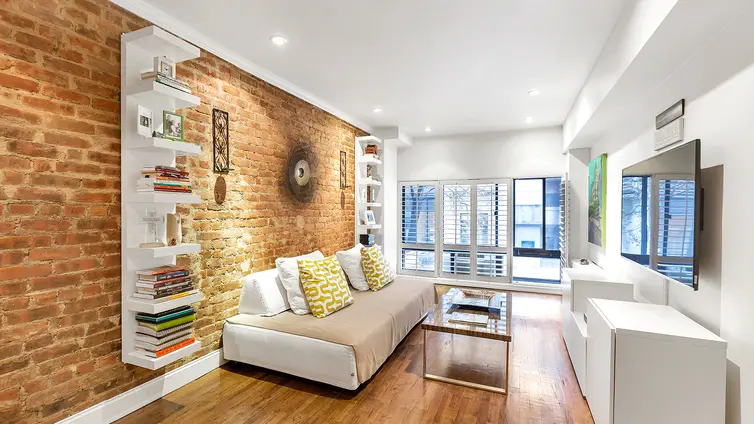
The Albert is a full-service pre-war cooperative designed by Henry Hardenbergh and located at 23 East 10th Street. The building has 24-hour door staff, a Resident Manager, full time handyman, porters, a renovated lobby, bike storage and a beautifully landscaped and furnished roof deck. A reasonable board allows parental purchase, pied-a-terre, and pets. Located halfway between Union Square and Washington Square Park, The Albert is on a beautiful, tree-lined Greenwich Village block close to multiple major subway lines, cultural attractions, shopping, the Union Square Greenmarket, and all the other conveniences which have made Greenwich Village New York City's preferred neighborhood for more than a century.

View school info, local attractions, transportation options & more.
Experience amazing 3D aerial maps and fly throughs.
For some co-ops, instead of price per square foot, we use an estimate of the number of rooms for each sold apartment to chart price changes over time. This is because many co-op listings do not include square footage information, and this makes it challenging to calculate accurate square-foot averages.
By displaying the price per estimated room count, we are able to provide a more reliable and consistent metric for comparing sales in the building. While we hope that this gives you a clearer sense of price trends in the building, all data should be independently verified. All data provided are only estimates and should not be used to make any purchase or sale decision.
Broker & Buyer Comments