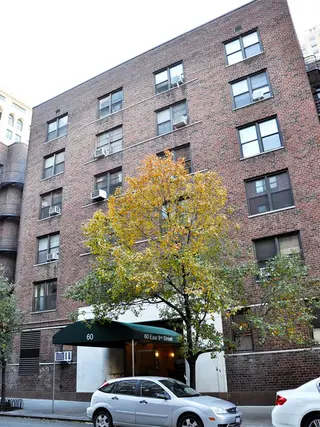
The Hamilton, 60 East 9th Street - Greenwich Village
- Apartments
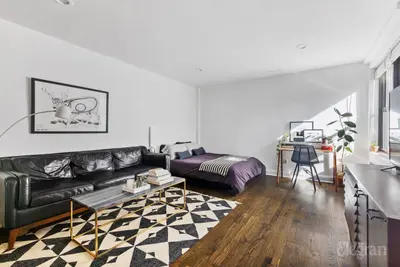
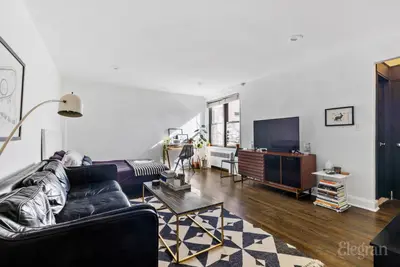
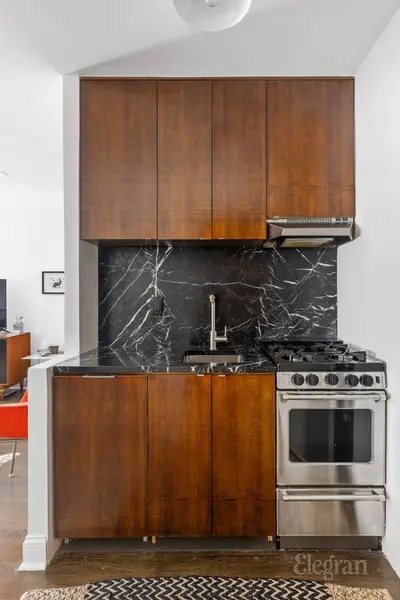
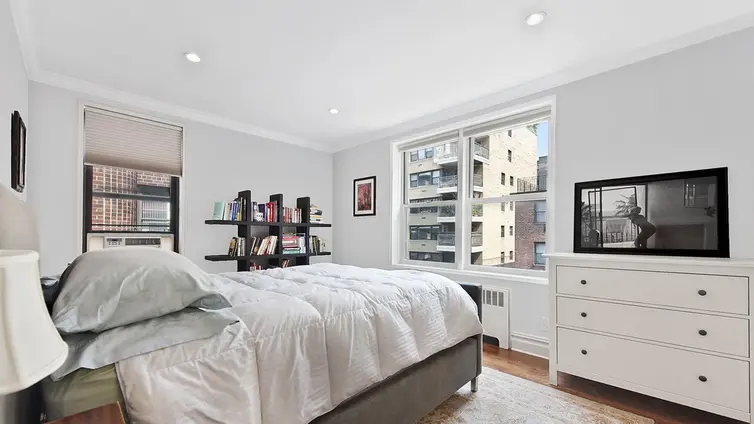
- Overview & Photos
- Maps
- Floorplans
- Sales Data & Comps
- Similar Buildings
- All Units

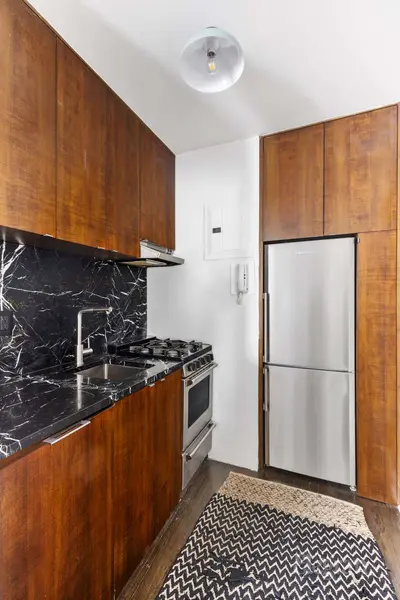


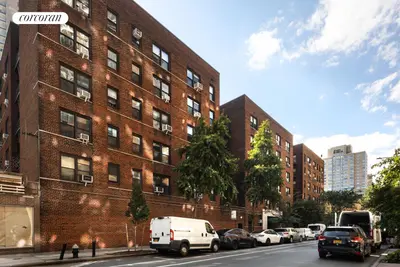
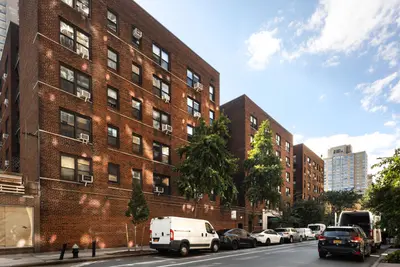
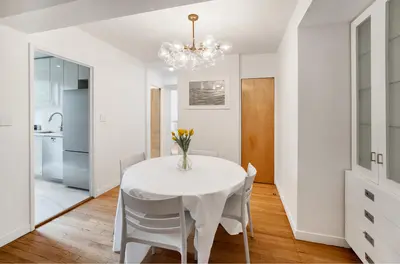

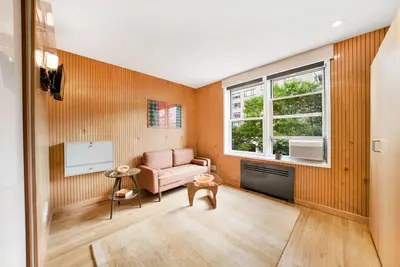

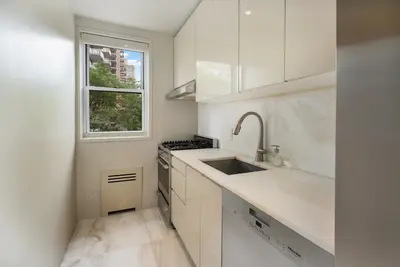
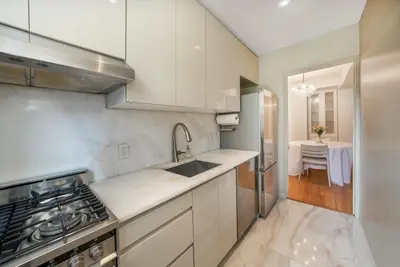
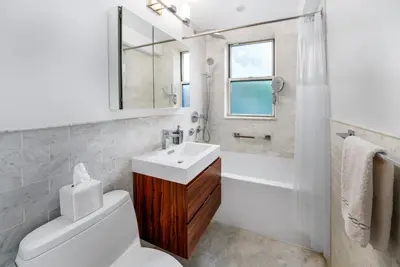
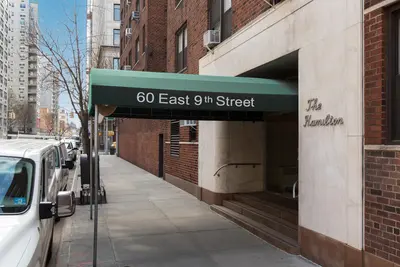
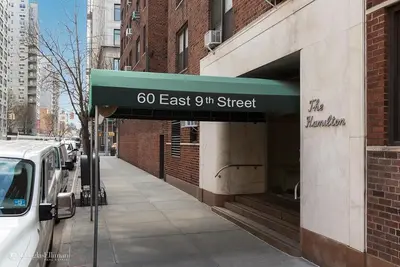
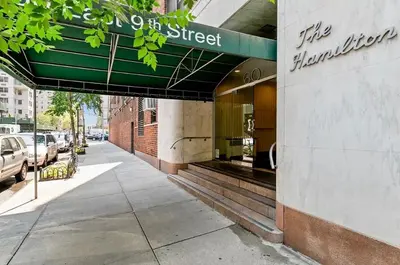
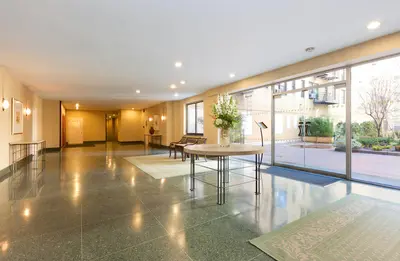
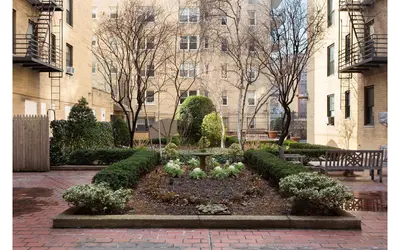
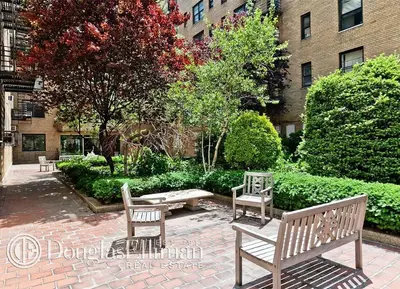
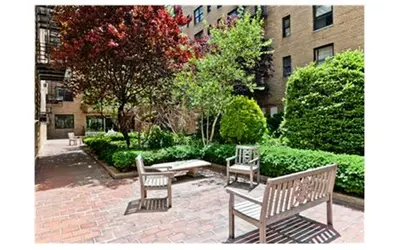
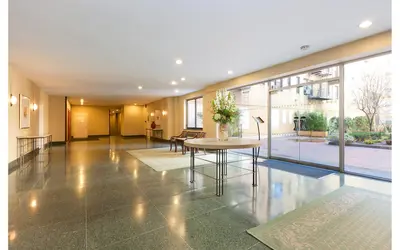
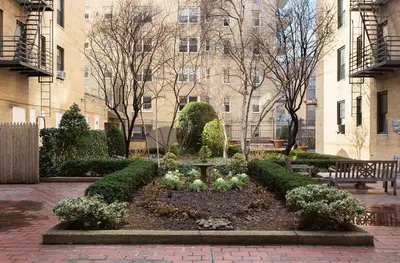
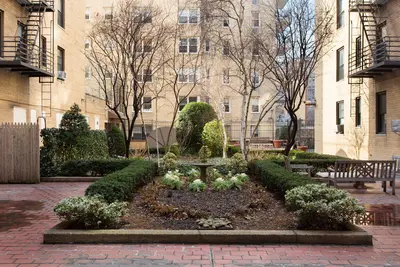
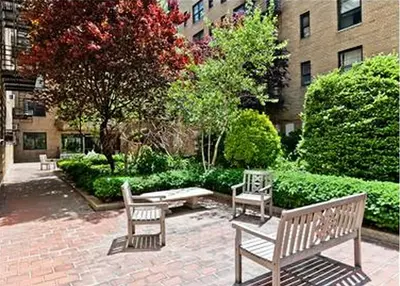
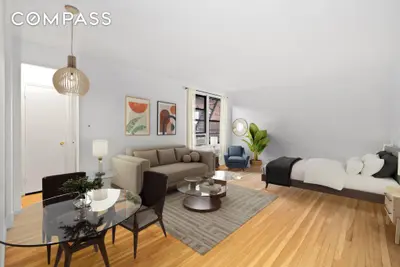
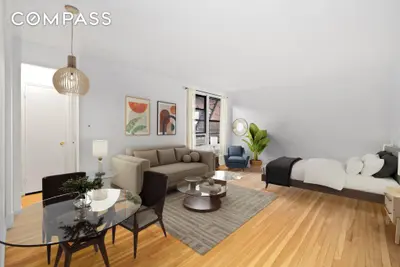
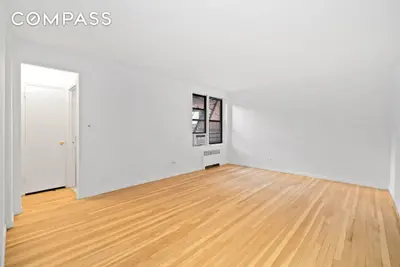


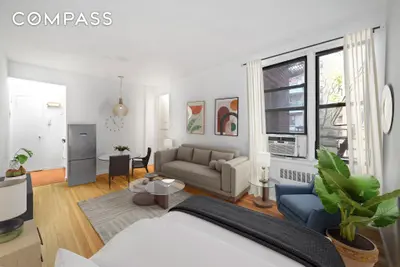

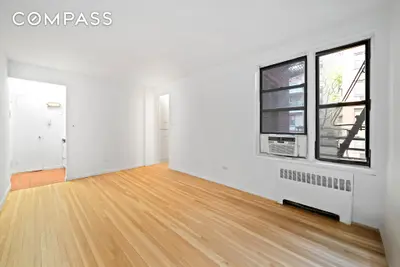


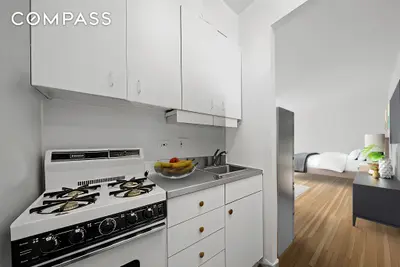
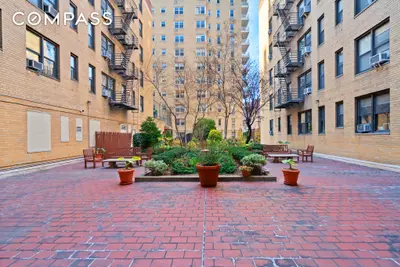


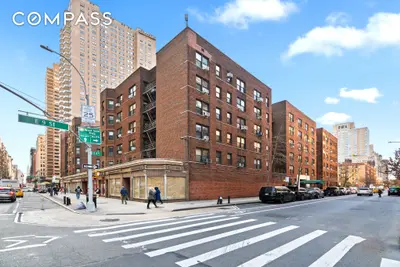
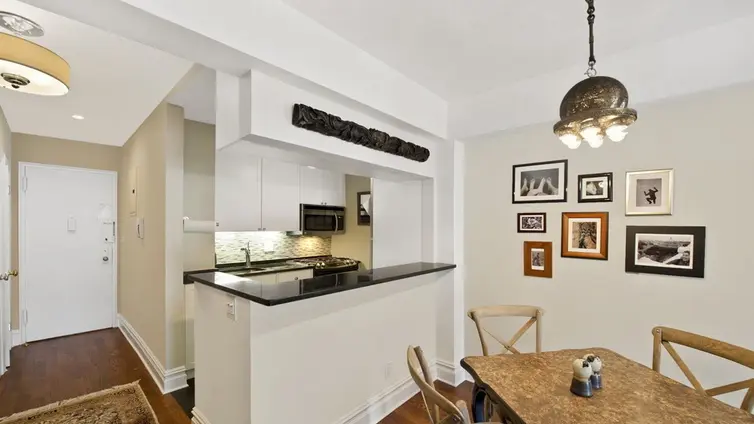
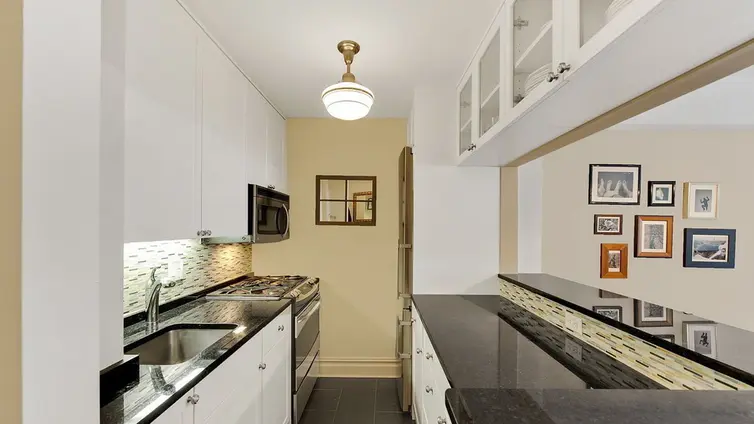
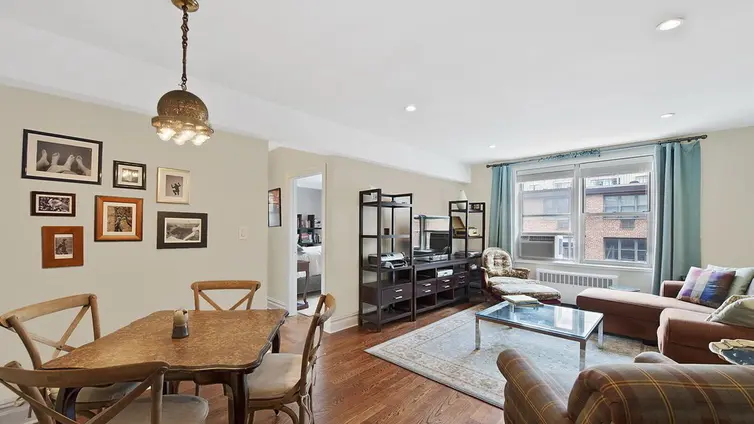
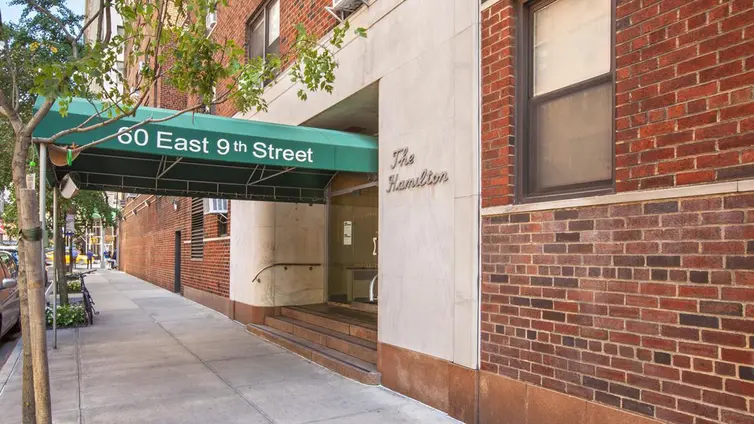
The Hamilton is a full-service cooperative with a 24-hour doorman, live-in superintendent, landscaped garden, fitness center, private storage, central laundry room, bike room, parking garage, and beautifully landscaped courtyard garden. It is located at 60 East 9th Street near Washington Square Park, Union Square Park, the Greenmarket, Whole Foods, Trader Joe's, and the 4/5/6, N/Q/R/W, and L trains. Pets are welcome, and the building permits guarantors, gifting, and subletting after two years of ownerships for up to three years. Pied-a-terres, purchasing for children, and co-purchasing are prohibited.

View school info, local attractions, transportation options & more.
Experience amazing 3D aerial maps and fly throughs.
For some co-ops, instead of price per square foot, we use an estimate of the number of rooms for each sold apartment to chart price changes over time. This is because many co-op listings do not include square footage information, and this makes it challenging to calculate accurate square-foot averages.
By displaying the price per estimated room count, we are able to provide a more reliable and consistent metric for comparing sales in the building. While we hope that this gives you a clearer sense of price trends in the building, all data should be independently verified. All data provided are only estimates and should not be used to make any purchase or sale decision.
Broker & Buyer Comments