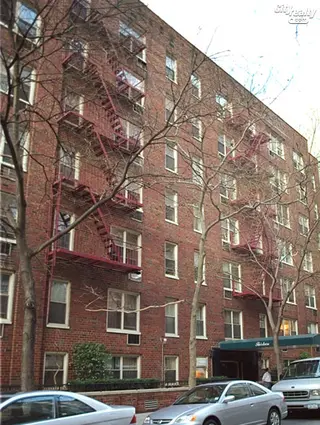
The Norville House, 13 West 13th Street: Price Comparison
between Fifth Avenue & Avenue of the Americas Building Profile
The Norville House
$692,333
Avg. Price
Past 12 months
Past 12 months
2024
$692,333
2023
$1,325,000
2022
$725,000
2021
$1,051,500
2020
$958,333
2019
$888,583
2018
$804,667
2017
$1,254,400
2016
$785,375
2015
$894,067
2014
$927,052
2013
$752,250
2012
$684,800
2011
$802,875
2010
$660,000
2009
$562,667
2008
$561,667
2007
$765,040
2006
$727,833
2005
$567,650
2004
$425,754
2003
$299,583
The Norville House
$555,000
Median Price
Past 12 months
Past 12 months
2024
$555,000
2023
$1,200,000
2022
$725,000
2021
$1,115,000
2020
$940,000
2019
$907,250
2018
$720,000
2017
$1,360,000
2016
$793,250
2015
$815,000
2014
$830,000
2013
$662,500
2012
$740,000
2011
$718,625
2010
$660,000
2009
$548,000
2008
$617,000
2007
$780,000
2006
$613,500
2005
$600,000
2004
$445,278
2003
$275,000
The Norville House
$522,500
Avg. Price
Past 12 months
Past 12 months
2024
$522,500
2023
-
2022
-
2021
-
2020
$570,000
2019
-
2018
$548,000
2017
-
2016
$415,000
2015
-
2014
$625,000
2013
$404,500
2012
$385,000
2011
-
2010
-
2009
$515,000
2008
-
2007
$415,500
2006
-
2005
$335,833
2004
$235,000
2003
$217,500
The Norville House
$522,500
Median Price
Past 12 months
Past 12 months
2024
$522,500
2023
-
2022
-
2021
-
2020
$570,000
2019
-
2018
$541,000
2017
-
2016
$415,000
2015
-
2014
$625,000
2013
$404,500
2012
$385,000
2011
-
2010
-
2009
$515,000
2008
-
2007
$415,500
2006
-
2005
$280,000
2004
$250,000
2003
$217,500
The Norville House
N/A
Avg. Price
Past 12 months
Past 12 months
2024
-
2023
-
2022
$725,000
2021
$821,250
2020
-
2019
$834,875
2018
$891,667
2017
$820,000
2016
$893,250
2015
$739,000
2014
$780,130
2013
$900,000
2012
$699,000
2011
$646,813
2010
$660,000
2009
$586,500
2008
$617,000
2007
$737,625
2006
$556,750
2005
$550,000
2004
$602,639
2003
$362,500
The Norville House
N/A
Median Price
Past 12 months
Past 12 months
2024
-
2023
-
2022
$725,000
2021
$821,250
2020
-
2019
$834,875
2018
$780,000
2017
$820,000
2016
$893,250
2015
$797,000
2014
$780,130
2013
$900,000
2012
$699,000
2011
$660,000
2010
$660,000
2009
$586,500
2008
$617,000
2007
$750,000
2006
$550,000
2005
$550,000
2004
$602,639
2003
$362,500
The Norville House
$1,032,000
Avg. Price
Past 12 months
Past 12 months
2024
$1,032,000
2023
$1,075,000
2022
-
2021
$1,205,000
2020
$1,152,500
2019
$996,000
2018
$1,187,500
2017
$1,363,000
2016
$940,000
2015
$1,126,667
2014
$1,225,000
2013
$1,300,000
2012
$780,000
2011
$1,130,000
2010
$660,000
2009
-
2008
$868,000
2007
$931,667
2006
$1,070,000
2005
$707,000
2004
$465,000
2003
-
The Norville House
$1,032,000
Median Price
Past 12 months
Past 12 months
2024
$1,032,000
2023
$1,075,000
2022
-
2021
$1,150,000
2020
$1,152,500
2019
$996,000
2018
$1,187,500
2017
$1,382,500
2016
$940,000
2015
$1,126,667
2014
$1,225,000
2013
$1,300,000
2012
$760,000
2011
$1,130,000
2010
$660,000
2009
-
2008
$868,000
2007
$785,000
2006
$1,070,000
2005
$696,000
2004
$465,000
2003
-
The Norville House
N/A
Avg. Price
Past 12 months
Past 12 months
2024
-
2023
-
2022
-
2021
-
2020
-
2019
-
2018
-
2017
-
2016
-
2015
-
2014
-
2013
-
2012
-
2011
-
2010
-
2009
-
2008
-
2007
-
2006
-
2005
-
2004
-
2003
-
The Norville House
N/A
Median Price
Past 12 months
Past 12 months
2024
-
2023
-
2022
-
2021
-
2020
-
2019
-
2018
-
2017
-
2016
-
2015
-
2014
-
2013
-
2012
-
2011
-
2010
-
2009
-
2008
-
2007
-
2006
-
2005
-
2004
-
2003
-
The Norville House
N/A
Avg. Price
Past 12 months
Past 12 months
2024
-
2023
-
2022
-
2021
-
2020
-
2019
-
2018
-
2017
-
2016
-
2015
-
2014
-
2013
-
2012
-
2011
-
2010
-
2009
-
2008
-
2007
-
2006
-
2005
-
2004
-
2003
-
The Norville House
N/A
Median Price
Past 12 months
Past 12 months
2024
-
2023
-
2022
-
2021
-
2020
-
2019
-
2018
-
2017
-
2016
-
2015
-
2014
-
2013
-
2012
-
2011
-
2010
-
2009
-
2008
-
2007
-
2006
-
2005
-
2004
-
2003
-

 6sqft delivers the latest on real estate, architecture, and design, straight from New York City.
