The Renwick, 808 Broadway - Greenwich Village
- Apartments
- Overview & Photos
- Maps
- Floorplans
- Sales Data & Comps
- Similar Buildings
- All Units


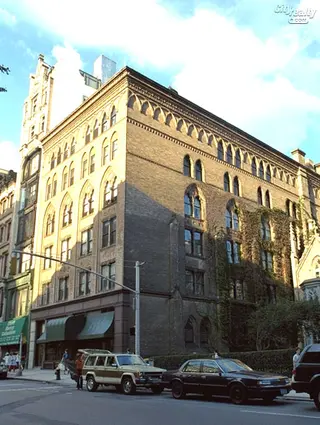
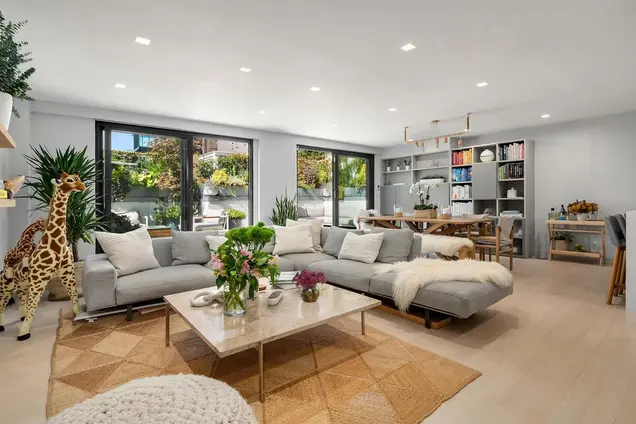
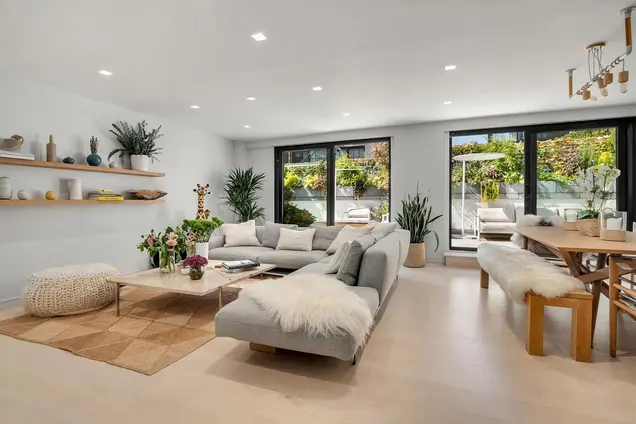
The Renwick is a pre-war 7-story, 61-unit cooperative in downtown Manhattan's Greenwich Village neighborhood, finished in 1845 and designed by James Renwick Jr., architect of St. Patrick's Cathedral and the nearby Grace Church. Its Gothic façade leads to a welcoming attended lobby, and a live-in superintendent is on staff. Amenities include a central laundry room, bike room, storage, and common gardens.
Situated at 808 Broadway, between West 11th Street and West 12th Street, the building enjoys excellent proximity to Washington Square Park, Union Square Park - of the Greenmarket and transit hub - and some of New York's finest restaurants and food shopping. Pets, parents buying for children, co-purchasing, guarantors, and gifting are welcomed on a case-by-case basis with board approval.
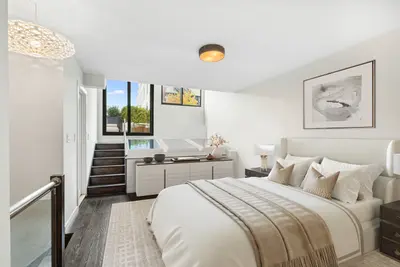
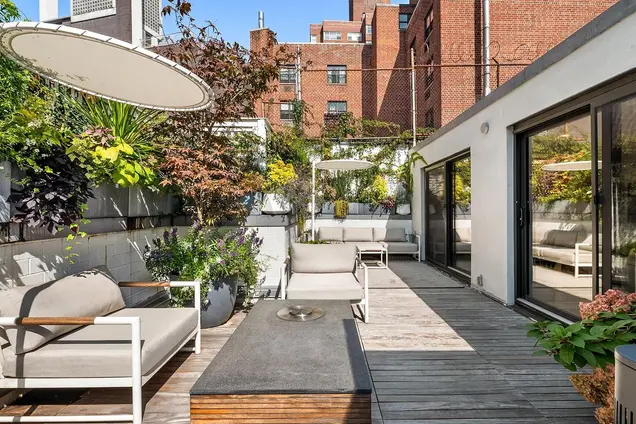
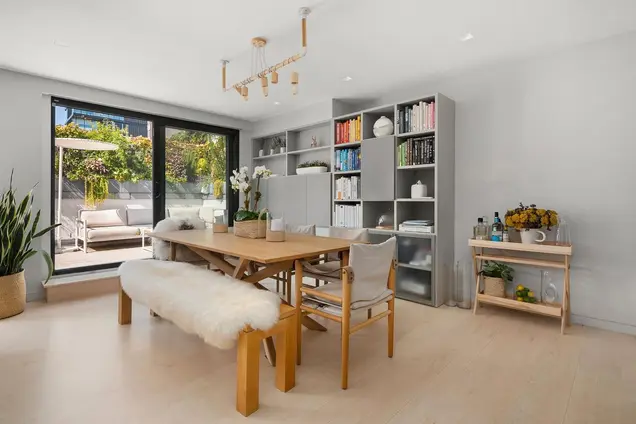
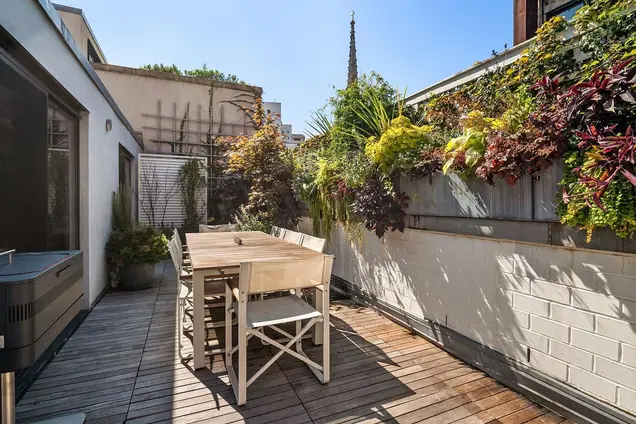
808 Broadway is a very well-maintained pet-friendly building with a 24-hour doorman, live-in superintendent, and two private outdoor spaces for residents and their guests. Located in the heart of Greenwich Village, Union Square, Whole Foods, Washington Square and Trader Joes are minutes away. The East Village, Noho, Flatiron, the West Village, and some of the world's best restaurants and shopping are all within easy reach.


View school info, local attractions, transportation options & more.
Experience amazing 3D aerial maps and fly throughs.
For some co-ops, instead of price per square foot, we use an estimate of the number of rooms for each sold apartment to chart price changes over time. This is because many co-op listings do not include square footage information, and this makes it challenging to calculate accurate square-foot averages.
By displaying the price per estimated room count, we are able to provide a more reliable and consistent metric for comparing sales in the building. While we hope that this gives you a clearer sense of price trends in the building, all data should be independently verified. All data provided are only estimates and should not be used to make any purchase or sale decision.
Broker & Buyer Comments