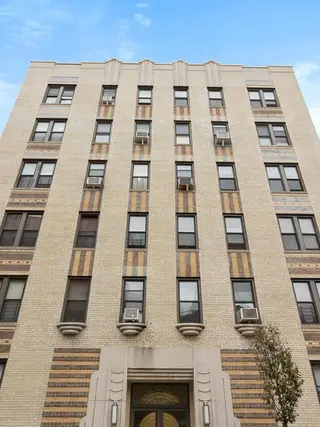
60 Cooper Street: Price Comparison
between West 204th Street & West 207th Street Building Profile
60 Cooper Street
$450,000
Avg. Price
Past 12 months
Past 12 months
2024
$332,600
2023
$407,435
2022
$493,873
2021
$430,000
2020
$514,000
2019
$430,000
2018
$431,400
2017
-
2016
$324,500
2015
$316,389
2014
$351,583
2013
$378,750
2012
$229,667
2011
$266,792
2010
$100,000
2009
$432,541
2008
$270,125
2007
$326,000
2006
$330,050
2005
$289,500
2004
$252,356
2003
-
60 Cooper Street
$450,000
Median Price
Past 12 months
Past 12 months
2024
$349,000
2023
$410,370
2022
$493,873
2021
$430,000
2020
$514,000
2019
$430,000
2018
$385,000
2017
-
2016
$354,500
2015
$320,500
2014
$313,500
2013
$328,500
2012
$245,000
2011
$276,909
2010
$100,000
2009
$410,000
2008
$288,750
2007
$326,000
2006
$320,000
2005
$284,500
2004
$217,462
2003
-
60 Cooper Street
N/A
Avg. Price
Past 12 months
Past 12 months
2024
$252,500
2023
-
2022
-
2021
-
2020
$250,000
2019
-
2018
$200,000
2017
-
2016
$210,000
2015
-
2014
$100,000
2013
-
2012
-
2011
$189,851
2010
-
2009
-
2008
$186,000
2007
-
2006
-
2005
-
2004
-
2003
-
60 Cooper Street
N/A
Median Price
Past 12 months
Past 12 months
2024
$252,500
2023
-
2022
-
2021
-
2020
$250,000
2019
-
2018
$200,000
2017
-
2016
$210,000
2015
-
2014
$100,000
2013
-
2012
-
2011
$189,851
2010
-
2009
-
2008
$186,000
2007
-
2006
-
2005
-
2004
-
2003
-
60 Cooper Street
$375,000
Avg. Price
Past 12 months
Past 12 months
2024
$386,000
2023
$407,435
2022
$425,000
2021
$430,000
2020
-
2019
$430,000
2018
$382,000
2017
-
2016
$374,000
2015
$316,389
2014
$303,167
2013
$256,500
2012
$229,667
2011
$269,703
2010
-
2009
$307,749
2008
$298,167
2007
$326,000
2006
$314,575
2005
$289,500
2004
$211,034
2003
-
60 Cooper Street
$375,000
Median Price
Past 12 months
Past 12 months
2024
$389,000
2023
$410,370
2022
$425,000
2021
$430,000
2020
-
2019
$430,000
2018
$382,000
2017
-
2016
$374,000
2015
$320,500
2014
$292,000
2013
$256,500
2012
$245,000
2011
$276,909
2010
-
2009
$307,749
2008
$315,000
2007
$326,000
2006
$314,575
2005
$284,500
2004
$211,034
2003
-
60 Cooper Street
$525,000
Avg. Price
Past 12 months
Past 12 months
2024
-
2023
-
2022
-
2021
-
2020
-
2019
-
2018
$596,500
2017
-
2016
$340,000
2015
-
2014
$435,000
2013
$387,000
2012
-
2011
$335,000
2010
-
2009
$410,000
2008
-
2007
-
2006
$361,000
2005
-
2004
$335,000
2003
-
60 Cooper Street
$525,000
Median Price
Past 12 months
Past 12 months
2024
-
2023
-
2022
-
2021
-
2020
-
2019
-
2018
$596,500
2017
-
2016
$340,000
2015
-
2014
$435,000
2013
$387,000
2012
-
2011
$335,000
2010
-
2009
$410,000
2008
-
2007
-
2006
$361,000
2005
-
2004
$335,000
2003
-
60 Cooper Street
N/A
Avg. Price
Past 12 months
Past 12 months
2024
-
2023
-
2022
-
2021
-
2020
$778,000
2019
-
2018
-
2017
-
2016
-
2015
-
2014
$665,000
2013
$615,000
2012
-
2011
-
2010
$100,000
2009
$579,873
2008
-
2007
-
2006
-
2005
-
2004
-
2003
-
60 Cooper Street
N/A
Median Price
Past 12 months
Past 12 months
2024
-
2023
-
2022
-
2021
-
2020
$778,000
2019
-
2018
-
2017
-
2016
-
2015
-
2014
$665,000
2013
$615,000
2012
-
2011
-
2010
$100,000
2009
$579,873
2008
-
2007
-
2006
-
2005
-
2004
-
2003
-
60 Cooper Street
N/A
Avg. Price
Past 12 months
Past 12 months
2024
-
2023
-
2022
-
2021
-
2020
-
2019
-
2018
-
2017
-
2016
-
2015
-
2014
-
2013
-
2012
-
2011
-
2010
-
2009
-
2008
-
2007
-
2006
-
2005
-
2004
-
2003
-
60 Cooper Street
N/A
Median Price
Past 12 months
Past 12 months
2024
-
2023
-
2022
-
2021
-
2020
-
2019
-
2018
-
2017
-
2016
-
2015
-
2014
-
2013
-
2012
-
2011
-
2010
-
2009
-
2008
-
2007
-
2006
-
2005
-
2004
-
2003
-
60 Cooper Street
N/A
Avg. Price
Past 12 months
Past 12 months
2024
-
2023
-
2022
-
2021
-
2020
-
2019
-
2018
-
2017
-
2016
-
2015
-
2014
-
2013
-
2012
-
2011
-
2010
-
2009
-
2008
-
2007
-
2006
-
2005
-
2004
-
2003
-
60 Cooper Street
N/A
Median Price
Past 12 months
Past 12 months
2024
-
2023
-
2022
-
2021
-
2020
-
2019
-
2018
-
2017
-
2016
-
2015
-
2014
-
2013
-
2012
-
2011
-
2010
-
2009
-
2008
-
2007
-
2006
-
2005
-
2004
-
2003
-

 6sqft delivers the latest on real estate, architecture, and design, straight from New York City.
