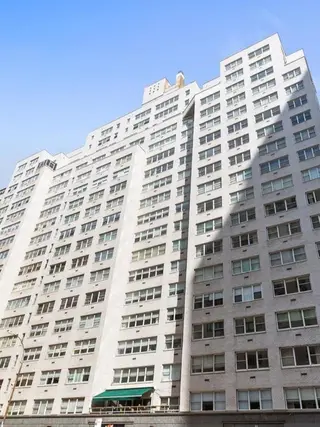
201 East 66th Street: Sales Summary
between Third Avenue & Second Avenue Building Profile
All Sales
$908
Avg. Price / ft2
Past 12 months, based on 9 sales
$761,556
Avg. Price -
Past 12 months, based on 9 sales
$908
Median Price / ft2
Past 12 months, based on 9 sales
$658,000
Median Price
Past 12 months, based on 9 sales
Year
Avg Price / Ft2
Median Price / Ft2
Avg. Actual Price
Med. Actual Price
Transactions
2025
-
$628,500
-
$628,500
2
2024
$908
$799,571
$908
$665,000
7
2023
-
$775,442
-
$680,000
13
2022
$768
$897,500
$768
$840,000
8
2021
$967
$961,796
$980
$735,000
21
2020
-
$1,345,000
-
$1,235,000
6
2019
-
$1,017,248
-
$799,900
7
2018
-
$1,180,833
-
$912,500
6
2017
$1,161
$929,087
$1,161
$795,000
15
2016
$1,207
$846,346
$1,207
$787,000
13
2015
$905
$787,500
$905
$628,500
6
2014
$927
$839,200
$927
$735,000
10
2013
$905
$629,444
$935
$555,000
9
Year
Avg Price / Ft2
Median Price / Ft2
Avg. Actual Price
Med. Actual Price
Transactions
2012
$550
$604,742
$550
$552,500
12
2011
$727
$622,889
$715
$617,500
9
2010
$752
$788,356
$736
$645,000
17
2009
$667
$502,200
$627
$500,000
5
2008
$832
$641,143
$832
$630,000
7
2007
$830
$848,273
$833
$692,000
11
2006
$809
$866,364
$793
$625,000
11
2005
$759
$849,917
$749
$650,500
12
2004
$676
$472,519
$676
$490,000
9
2003
$465
$566,786
$465
$405,000
7
The Breakdown of All Sales by Apartment Size